
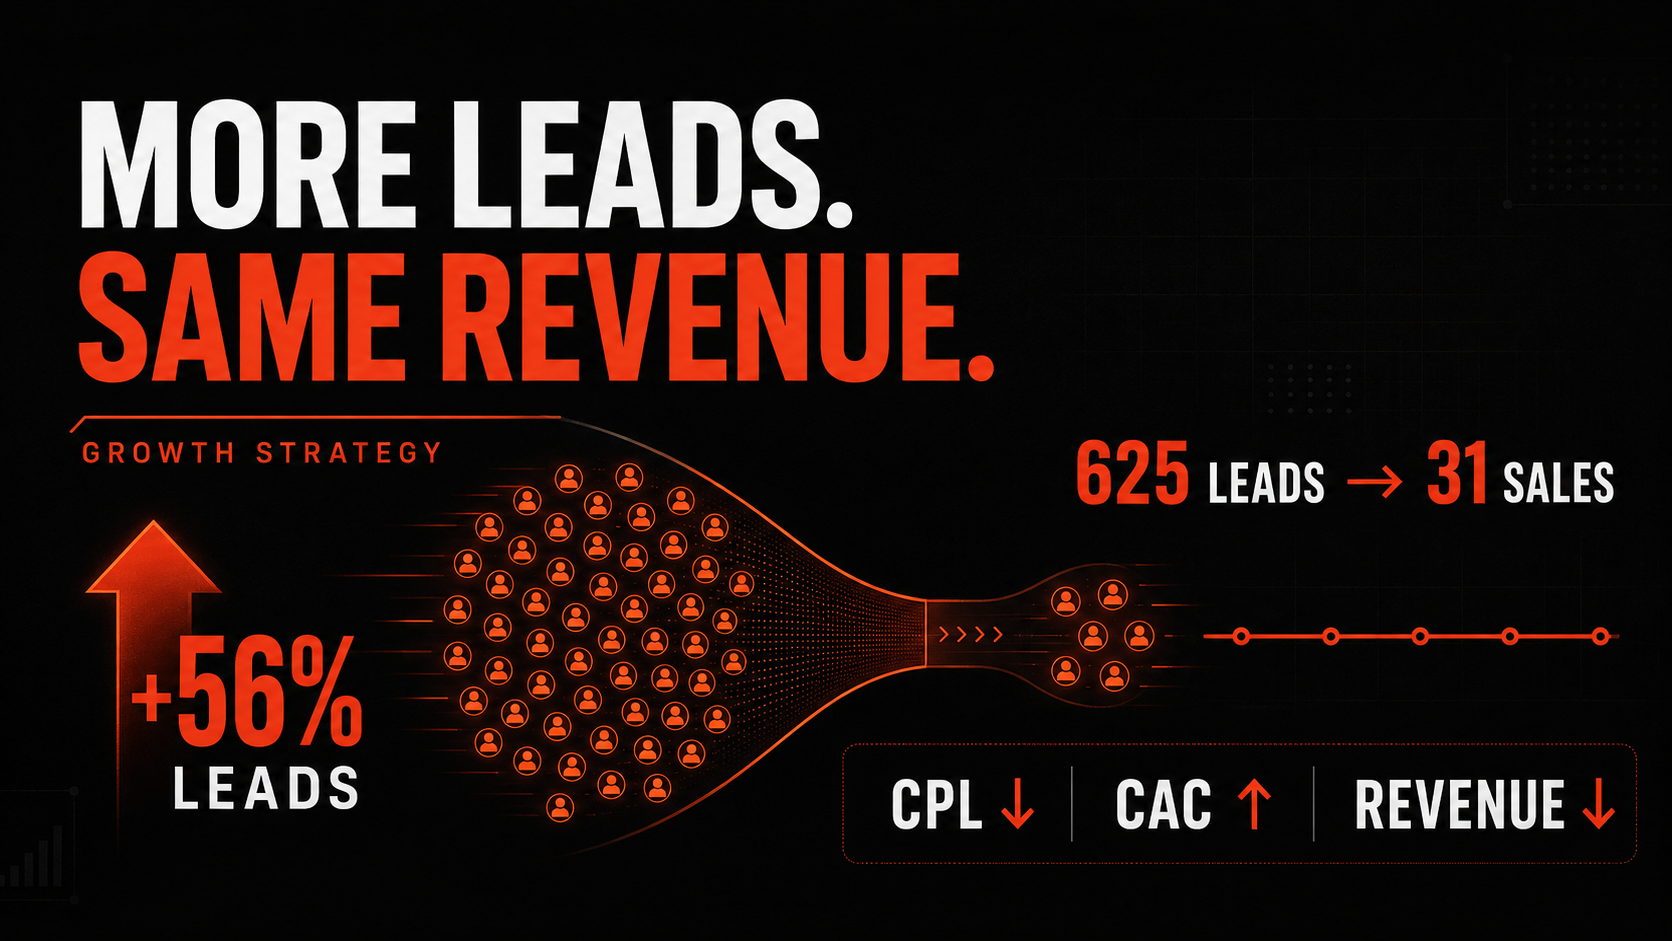
Generating more leads without more sales usually means that lead volume has improved while lead quality, sales conversion, deal value or sales capacity has deteriorated. It can also mean that revenue is merely delayed by a longer sales cycle. The answer is not automatically to buy more traffic or demand more leads. It is to find the stage at which commercially valuable demand is being lost.
For a lead-generation business, marketing performance should be assessed through the complete journey:
Marketing spend → website traffic → leads → qualified leads → opportunities → customers → revenue → contribution profit
A lower cost per lead can look like progress while the cost of acquiring a customer rises. A campaign can generate a record number of enquiries while sales remain flat. Marketing can meet its target while the business misses its revenue plan.
The management question is therefore not “How many leads did we generate?” It is:
How much incremental revenue and contribution profit did those leads create, and where did the rest of the opportunity disappear?
Why more leads without more sales is a commercial warning
A lead is an expression of interest, not a customer. It may be a suitable prospect, but it may also be a duplicate, an existing customer, a job applicant, an irrelevant enquiry, a competitor, a price shopper or someone who cannot afford the service.
Lead volume becomes particularly misleading when advertising platforms optimise towards the easiest form submission rather than the eventual sale. If a broad audience produces cheap enquiries, the platform can find more people who resemble those enquirers—even when they rarely become customers.
That creates an apparently successful report:
| Metric | Previous period | Current period | Apparent result |
|---|---|---|---|
| Marketing spend | £20,000 | £25,000 | Up 25% |
| Leads | 400 | 625 | Up 56% |
| Cost per lead | £50 | £40 | Improved 20% |
| Customers | 40 | 31 | Down 23% |
| Lead-to-sale rate | 10.0% | 5.0% | Almost halved |
| Customer acquisition cost | £500 | £806 | Worsened 61% |
| Average sale value | £5,000 | £4,500 | Down 10% |
| Revenue | £200,000 | £139,500 | Down 30% |
The marketing dashboard celebrates a £10 reduction in cost per lead. The board sees £60,500 less revenue and a much higher acquisition cost. Both reports describe the same activity, but only one follows the lead far enough to reveal its commercial value.
Calculate the entire lead-to-revenue journey
Every lead-generation business should be able to calculate the following measures by channel, campaign, service, location and customer type.
Visitor-to-lead conversion rate
Visitor-to-lead conversion rate = Leads ÷ relevant website sessions × 100
This shows how effectively the website turns traffic into enquiries. A higher rate is not necessarily better if forms have become easier for unsuitable prospects to complete.
Cost per lead
Cost per lead = Marketing spend ÷ leads
Cost per lead is a useful operating measure, but it contains no information about quality, sales conversion, deal value or margin.
Qualified-lead rate
Qualified-lead rate = Qualified leads ÷ total leads × 100
Qualification must use an agreed definition. Depending on the business, it might include need, budget, authority, location, timing, minimum order value or product fit.
Lead-to-sale conversion rate
Lead-to-sale conversion rate = New customers ÷ total leads × 100
Also calculate conversion from qualified lead to opportunity and opportunity to closed sale. A single overall rate tells you that a problem exists; stage-level rates reveal where it is.
Customer acquisition cost
Customer acquisition cost = Relevant marketing and sales acquisition costs ÷ new customers
Include media, agency or internal marketing costs and the appropriate sales cost. A cost-per-lead report that excludes the people required to qualify and close those leads understates the real cost of sale.
Revenue per lead
Revenue per lead = Revenue from the lead cohort ÷ leads in that cohort
Cohort reporting matters. Leads created in March may close in May, so comparing March leads with March sales can produce a false conclusion when the sales cycle is long.
Contribution profit per lead
Contribution profit per lead = Contribution profit from acquired customers ÷ leads generated
This is often more useful than revenue per lead. It accounts for the fact that £10,000 of revenue from a low-margin service may be less valuable than £6,000 from a high-margin one.
Work backwards to an allowable cost per lead
Instead of accepting whatever cost per lead a platform produces, calculate what the business can afford.
Suppose a new customer produces £3,000 of expected contribution before sales and marketing costs. The business requires £1,800 to cover overheads, risk and target profit. Its allowable customer acquisition cost is therefore £1,200.
If 8% of valid leads become customers:
Allowable cost per lead = Allowable customer acquisition cost × lead-to-sale conversion rate
£1,200 × 8% = £96
At that conversion rate, a lead costing £80 may be commercially acceptable. If lead-to-sale conversion falls to 4%, the allowable cost per lead falls to £48. The media team has not changed the unit economics; the decline in downstream conversion has changed what a lead is worth.
This calculation should be made separately where customer values or close rates differ. A board-level enquiry for a £50,000 engagement should not carry the same value as an enquiry for a £1,000 project.
The most common reasons leads rise while sales stay flat
1. Lead quality has declined
The additional leads may come from broader keywords, looser audiences, lead magnets, automated placements or offers that reward submission without indicating genuine buying intent.
Compare qualified-lead rate, opportunity rate, customer rate and revenue per lead by:
- Channel and campaign.
- Search term or audience.
- Landing page and form.
- Device and geography.
- Service or product interest.
- New versus existing customer.
- Sales representative.
If overall lead volume rises while qualified-lead volume remains flat, marketing has increased activity rather than opportunity.
2. Advertising is optimising to the wrong conversion
An ad platform asked to maximise form submissions will seek people likely to submit forms. It does not automatically know which prospects pass qualification, attend a meeting, accept a proposal or become profitable customers.
The solution is to send deeper outcomes back from the CRM. Google Analytics recommends events across the lead lifecycle, including generate_lead, qualify_lead, working_lead and close_convert_lead, enabling the funnel to be measured beyond the original enquiry. Google Analytics recommended events
For Google Ads, enhanced conversions for leads can connect first-party lead information and imported offline outcomes with prior ad interactions. Google recommends using a qualified-lead or converted-lead goal rather than stopping at an initial form where the later outcome is available. Google Ads enhanced conversions for leads
The objective is not to upload every CRM status as an equal primary conversion. It is to give measurement and bidding a reliable signal that reflects genuine commercial progress.
3. Response time has deteriorated
More leads can overwhelm an unchanged sales team. Enquiries wait in inboxes, calls go unanswered and prospects speak to competitors first.
Measure:
- Median time to first meaningful response.
- Percentage contacted within the target service level.
- Contact rate.
- Number and timing of follow-up attempts.
- Meeting-booked rate.
- No-show rate.
Report these by lead source. A channel may look weak because leads arrive outside staffed hours or are routed incorrectly, not because the prospects lack intent.
4. Sales capacity has reached its limit
If each salesperson can properly handle 80 new leads per month, sending 150 does not guarantee more sales. It can reduce attention across the whole pipeline.
Capacity planning should connect forecast demand to:
- Leads per representative.
- Active opportunities per representative.
- Required calls, meetings and proposals.
- Average handling time.
- Sales-cycle length.
- Planned holidays and recruitment.
Marketing scale and sales capacity must be planned together. Otherwise, cheaper acquisition simply creates a more expensive backlog.
5. Qualification definitions are inconsistent
Marketing may call a completed form a marketing-qualified lead, while sales recognises only prospects with confirmed budget and timing. One representative may disqualify an enquiry another would pursue.
Create shared, auditable definitions for:
- Valid lead.
- Marketing-qualified lead.
- Sales-accepted lead.
- Sales-qualified opportunity.
- Proposal issued.
- Closed won and closed lost.
Require a reason when a lead is disqualified or lost. Categories such as no budget, unsuitable requirement, outside service area, duplicate, competitor, unreachable and timing too distant create an actionable feedback loop.
6. Follow-up is too weak or too short
Not every credible buyer is ready after one call. A weak process treats “no immediate answer” as “no interest”, even in categories with a considered purchase.
Build a follow-up sequence appropriate to the sales cycle using calls, useful email, reminders, proof, case studies and retargeting. Automation should support timely action without replacing judgement or sending generic messages that damage trust.
7. The offer attracts enquiries but not buyers
A free audit, calculator, guide or consultation can increase lead volume while attracting people unwilling or unable to buy. The landing page may over-promise, hide the likely investment or appeal to an audience outside the business’s ideal customer profile.
Review the message from advert to sales conversation. The proposition should make suitability clearer, not merely maximise the form-completion rate.
Useful qualification can be introduced through service range, minimum engagement, geography, timing or a small number of carefully chosen form fields. Do not add friction blindly; test whether each question improves sales efficiency enough to justify any reduction in lead volume.
8. The sales cycle has lengthened
Flat revenue this month does not necessarily mean recent leads failed. Larger deals, economic uncertainty, procurement requirements or a different customer mix may lengthen the time between first enquiry and signed contract.
Use lead cohorts based on creation date and track their conversion after 30, 60, 90, 180 days or the relevant period. Compare cohorts only after they have had comparable time to mature.
Track:
- Median days from lead to qualification.
- Qualification to opportunity.
- Opportunity to proposal.
- Proposal to sale.
- Pipeline value and probability.
- Expected close date slippage.
A predictable timeline matters because it determines cash flow and when marketing investment can reasonably be judged.
9. Average sales value has fallen
Sales volume may rise slightly while revenue remains flat because new customers buy smaller services, negotiate larger discounts or enter through a low-value offer.
Separate the funnel by service line, contract size and customer type. Measure average sale value, contribution margin, expansion revenue and retention—not only the number of wins.
10. Tracking or attribution is broken
Form submissions may be duplicated. Calls may not be connected to campaigns. CRM source fields may be overwritten. Renewals may be counted as new sales. A sale may be credited to the last interaction while the channel that created the demand is ignored.
Reconcile the stages using stable identifiers:
- Website or call-tracking lead.
- CRM lead record.
- Qualified lead and opportunity.
- Closed customer.
- Invoice or payment.
- Recognised revenue and contribution.
Google explains that offline conversion imports are designed for journeys in which an advert begins a path that later closes by telephone, in an office or through another offline process. Connecting the CRM outcome prevents measurement from ending at the click or form. Google Ads offline conversion imports
Determine whether the problem belongs to marketing, sales or operations
Avoid the unproductive question “Whose fault is it?” Use the data to locate the constraint.
| Pattern | Most likely area to investigate |
| Traffic rises, lead rate falls | Targeting, message or landing-page relevance |
| Leads rise, qualified leads stay flat | Lead quality, form design or channel expansion |
| Qualified leads rise, contact rate falls | Routing, response time or sales capacity |
| Meetings rise, proposals stay flat | Discovery quality, fit or sales process |
| Proposals rise, wins stay flat | Pricing, competition, proof or negotiation |
| Customers rise, revenue stays flat | Deal size, discounting or product mix |
| Revenue rises, profit stays flat | Margin, delivery cost or acquisition cost |
| Platform sales rise, company sales stay flat | Attribution, duplication or cannibalisation |
The pattern can span functions. Poor keyword targeting is a marketing issue; slow response is a sales-operation issue; weak pricing competitiveness is a commercial issue. The recovery plan should follow the constraint rather than departmental boundaries.
Compare channels by sales value, not lead price
Google Ads, SEO, content, paid social, email and referral activity play different roles. Comparing them only by cost per lead rewards channels that produce easy, low-intent responses.
Use a consistent channel scorecard:
| Metric | Why it matters |
| Valid leads | Removes spam, duplicates and ineligible enquiries |
| Qualified-lead rate | Shows commercial relevance |
| Sales-accepted rate | Tests whether marketing and sales agree on quality |
| Lead-to-customer rate | Connects acquisition to outcomes |
| Average sales value | Reveals differences in deal mix |
| Revenue per lead | Combines conversion and value |
| Fully loaded acquisition cost | Includes relevant marketing and sales cost |
| Contribution profit | Shows whether growth creates economic value |
| Sales-cycle length | Reveals cash-flow and maturity differences |
| New-customer share | Separates acquisition from existing demand |
SEO and content may create early research demand that closes later through branded search or direct traffic. Paid search may capture prospects already near a decision. Email may progress existing leads rather than create them. The management view should recognise these roles while still requiring each investment to demonstrate commercial contribution.
Forecast the funnel before increasing budget
A simple revenue model makes assumptions visible:
Forecast customers = Website sessions × visitor-to-lead rate × lead-to-sale rate
Forecast revenue = Forecast customers × average sales value
Suppose the plan is:
- 20,000 relevant sessions.
- 4% visitor-to-lead conversion.
- 8% lead-to-sale conversion.
- £6,000 average sale value.
The forecast is:
- 800 leads.
- 64 customers.
- £384,000 revenue.
If the lead-to-sale rate falls to 4%, the same traffic and lead volume produce 32 customers and £192,000 revenue. Doubling traffic to compensate may double acquisition and processing costs without repairing the underlying failure.
Create base, downside and upside scenarios. State the expected sales-cycle delay and the capacity required to handle each level of demand.
A 90-day recovery plan
Days 1–30: establish commercial truth
- Agree funnel-stage definitions with marketing, sales and finance.
- Reconcile form, telephone, CRM, sales and finance records.
- Remove duplicates, spam and existing-customer service enquiries.
- Calculate qualified-lead rate, close rate, revenue and contribution by source.
- Measure first-response time, contact rate and lead ageing.
- Identify where the largest numerical drop occurs.
- Document current sales capacity and lead-routing rules.
Do not make sweeping media changes until tracking has been checked. Cutting a valuable campaign because the CRM loses its source would compound the problem.
Days 31–60: repair the constraint
- Tighten keywords, audiences and exclusions where quality is weak.
- Align landing-page claims and qualification with the ideal customer profile.
- Automate routing, alerts and overdue follow-up.
- Train or resource the team where contact and progression are weak.
- Introduce consistent loss reasons and pipeline stages.
- Connect qualified and closed outcomes back to acquisition platforms.
- Separate high-value services and customer segments in reporting.
Choose a small number of changes tied to a diagnosed cause. Changing targeting, forms, pricing and sales scripts simultaneously makes the effect difficult to identify.
Days 61–90: test and reallocate
- Compare mature lead cohorts with the previous baseline.
- Review cost per qualified lead, customer acquisition cost and revenue per lead.
- Calculate contribution profit by campaign and service.
- Move budget away from activity that produces volume without value.
- Scale sources whose marginal spend continues to produce acceptable customers.
- Set monthly funnel targets linked to the revenue plan.
What the board dashboard should show
A useful executive dashboard should fit on one page and preserve the connection from spend to profit:
- Marketing spend.
- Relevant website traffic.
- Total and valid leads.
- Cost per valid lead.
- Qualified leads and qualification rate.
- Sales-accepted leads.
- Opportunities and pipeline value.
- New customers and lead-to-sale rate.
- Average sales value.
- Revenue per lead.
- Customer acquisition cost.
- Contribution profit and payback period.
- Median sales-cycle length.
- Results by channel, campaign and service line.
Show current performance, target, prior period and a mature comparable cohort. Add operational context such as team capacity, major pricing changes or an unusually large deal rather than allowing averages to conceal them.
The practical answer
If you are generating more leads without a matching increase in sales or revenue, stop treating lead volume as the outcome. Trace every lead cohort through qualification, contact, opportunity, sale, revenue and contribution profit.
The diagnosis normally reveals one or more of five constraints: poorer lead quality, slower or weaker follow-up, limited sales capacity, falling deal value or incomplete measurement. Once the constraint is visible, marketing and sales can optimise the same commercial system instead of pursuing conflicting departmental targets.
The right goal is not the lowest cost per lead. It is a predictable flow of qualified demand that becomes profitable revenue at an acquisition cost and within a timeframe the business can sustain.
Book a Strategy Call
If lead numbers are rising but sales, revenue or profit are not following, Clubbish can audit the complete journey from channel and campaign through CRM, sales conversion and commercial return. We will identify where value is being lost, establish the funnel economics and prioritise the changes most likely to restore profitable growth.