
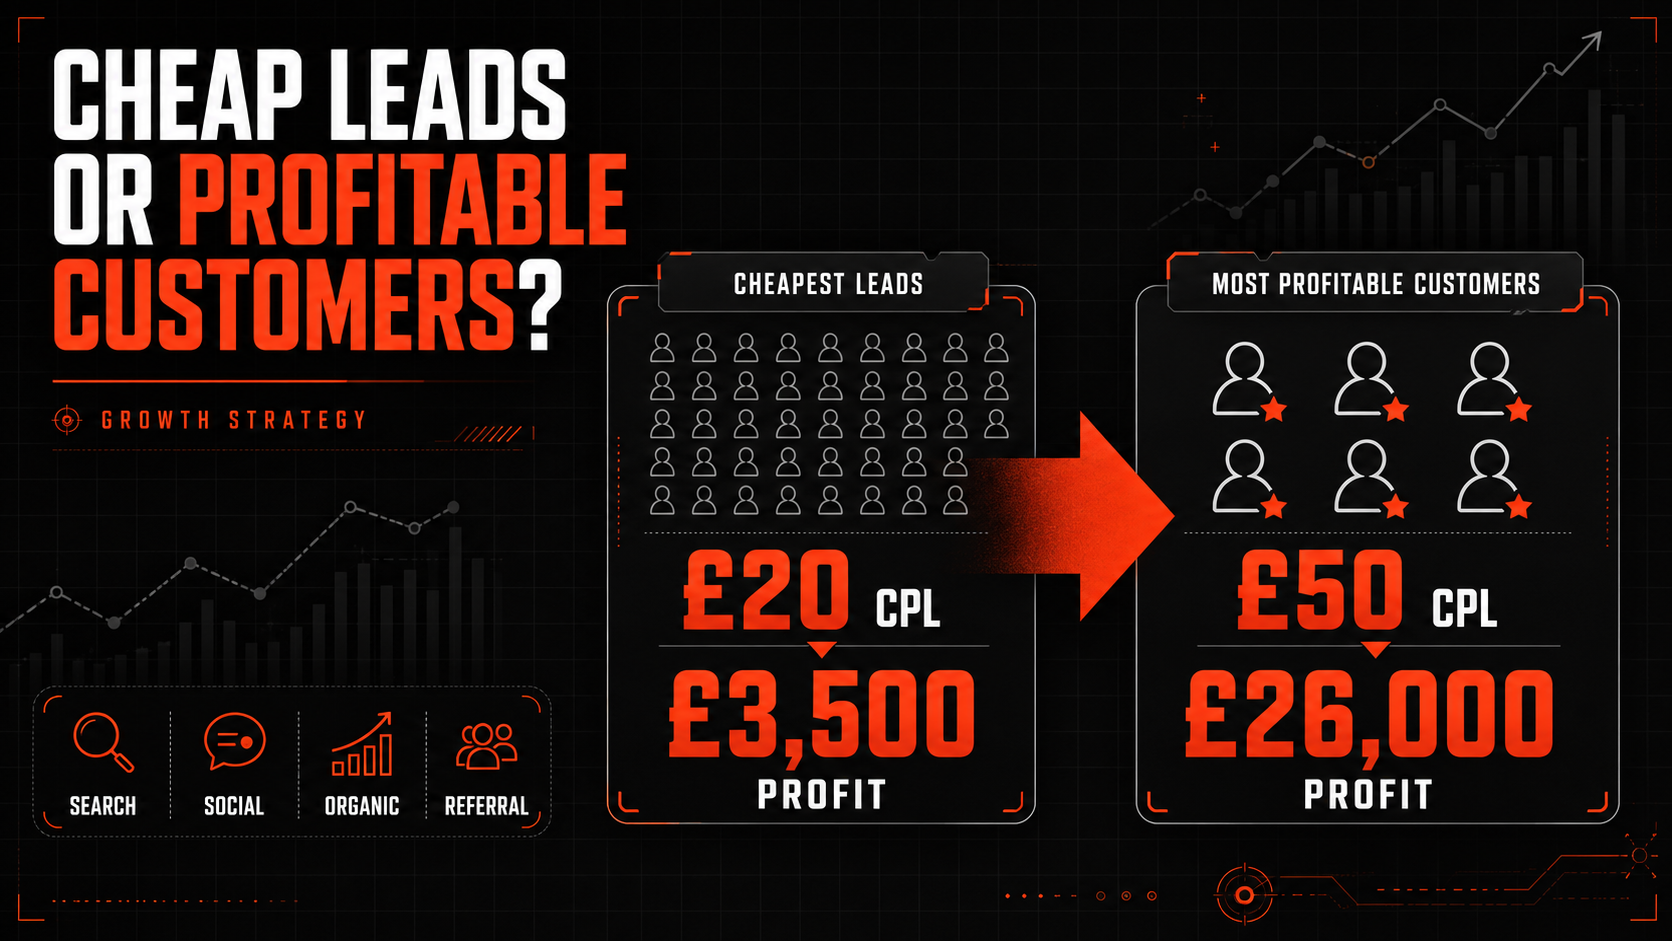
The most profitable marketing channel is not necessarily the one generating the cheapest leads, the highest attributed ROAS or the lowest platform CPA. It is the channel that creates the greatest incremental customer contribution after marketing, sales, delivery, returns and other relevant costs—within an acceptable payback period.
There is no universal winner. Organic search may produce excellent long-term economics for one company. Paid search may create the best high-intent customers for another. Meta may appear weaker on first-click reporting but introduce valuable customers who later convert through Google or direct traffic. Referrals may have the lowest acquisition cost but too little volume to deliver the growth plan.
The correct question is:
Which channel produces the greatest sustainable incremental contribution profit per customer and per additional pound invested?
Answering it requires customer-level economics, consistent channel costing, cohort measurement and a clear distinction between attribution and causality.
Why the cheapest lead can produce the most expensive customer
Cost per lead measures only the price of creating an enquiry:
CPL = Channel cost ÷ Leads
It does not reveal whether those leads are valid, qualify, become customers, buy a profitable product, stay, repeat or would have purchased without the channel.
Suppose two channels each receive £10,000:
| Metric | Channel A | Channel B |
|---|---|---|
| Leads | 500 | 200 |
| CPL | £20 | £50 |
| Lead-to-sale rate | 3% | 15% |
| New customers | 15 | 30 |
| Media CAC | £666.67 | £333.33 |
| Contribution before acquisition per customer | £900 | £1,200 |
| Contribution after media per customer | £233.33 | £866.67 |
| Total contribution after media | £3,500 | £26,000 |
Channel A produces the cheaper lead but the more expensive customer, weaker customer value and far less total contribution. Optimising for CPL would send more budget to the worse commercial outcome.
Define a profitable customer
A profitable customer creates enough contribution to cover acquisition, support fixed overheads and provide the return required by the business.
For a product or e-commerce company:
Customer contribution before acquisition = Revenue − Product cost − Fulfilment − Payment fees − Discounts − Expected returns
For a service or lead-generation business:
Customer contribution before acquisition = Revenue − Direct delivery labour − Contractors − Commission − Onboarding − Variable support − Bad-debt allowance
Then:
Customer contribution after acquisition = Customer contribution before acquisition − True CAC
True CAC should include the relevant channel, marketing and sales costs required to win new customers:
True CAC = Relevant marketing and sales acquisition cost ÷ New customers
A channel is not commercially attractive merely because customer contribution after acquisition is positive. The remaining contribution must also satisfy the company’s margin, overhead and payback requirements.
How to identify the most profitable marketing channel
Every acquisition channel should be assessed through the same commercial framework.
| Metric | What it reveals |
| Valid leads | Removes spam, duplicates and ineligible enquiries |
| Qualified-lead rate | Measures commercial relevance |
| Lead-to-customer rate | Connects marketing with sales outcomes |
| New customers | Separates acquisition from existing demand |
| True CAC | Shows full acquisition cost |
| First-order contribution | Tests immediate economics |
| 6- or 12-month contribution | Captures repeat or retained value |
| Contribution after CAC | Shows actual customer-level return |
| Payback period | Shows how quickly cash is recovered |
| Incremental customers | Estimates customers caused by the channel |
| Marginal CAC | Prices the next customers, not the historic average |
| Total incremental contribution | Shows the channel’s scalable business impact |
Use revenue and attributed ROAS as supporting metrics, not final decision measures.
A worked channel comparison
Assume a lead-generation company compares paid search, paid social, organic search and referrals over mature customer cohorts.
| Metric | Paid search | Paid social | Organic search | Referral |
| Fully allocated acquisition cost | £60,000 | £50,000 | £36,000 | £12,000 |
| Valid leads | 600 | 1,000 | 400 | 120 |
| CPL | £100 | £50 | £90 | £100 |
| New customers | 90 | 60 | 80 | 36 |
| Lead-to-sale rate | 15% | 6% | 20% | 30% |
| True CAC | £666.67 | £833.33 | £450 | £333.33 |
| 12-month contribution per customer before CAC | £3,200 | £4,500 | £3,000 | £2,000 |
| Contribution after CAC per customer | £2,533.33 | £3,666.67 | £2,550 | £1,666.67 |
| Total contribution after acquisition | £228,000 | £220,000 | £204,000 | £60,000 |
Several different answers emerge:
- Cheapest leads: Paid social at £50.
- Lowest true CAC: Referral at £333.33.
- Highest profit per acquired customer: Paid social at £3,666.67.
- Highest total customer contribution: Paid search at £228,000.
- Highest close rate: Referral at 30%.
No single metric identifies the best channel for every decision. Referral is extremely efficient but does not provide enough volume to lead total growth. Paid social creates the most valuable customers but has a weaker close rate. Paid search generates the highest total contribution in the measured period.
The budget decision also depends on what happens to the next pound, not only the average result shown above.
Treat acquisition and retention channels differently
Email, SMS, direct traffic and branded search often appear highly efficient because they serve customers or prospects whose demand already exists.
They remain commercially important, but their roles differ:
- Acquisition channels introduce or convert genuinely new customers.
- Demand-capture channels convert existing commercial intent.
- Retention channels create repeat purchase, renewal and expansion.
- Assisting channels influence research and later conversion elsewhere.
Do not compare a new-customer Meta campaign with an email sent to past buyers using the same CAC or ROAS standard. The email may create excellent retention profit, but it is not evidence that email acquired those customers originally.
Report separate objectives:
| Channel role | Primary commercial measures |
| New-customer acquisition | New-customer CAC, contribution, payback and incrementality |
| Demand capture | Incremental conversion, margin and cannibalisation |
| Retention | Repeat contribution, churn, frequency and lifetime value |
| Brand or demand creation | Lift, assisted journeys, later branded demand and cohort value |
Understand how channels typically contribute
There is no guaranteed profitability hierarchy, but each channel has characteristic strengths and measurement risks.
Organic search
SEO can generate valuable non-brand demand and improve economics over time because additional clicks do not carry a direct media fee. However, content, technical development, digital PR, tools and internal resource are real acquisition costs.
Measure organic customer cohorts, not “free traffic”. Separate brand and non-brand demand, commercial landing pages and informational research journeys.
Paid search and Shopping
Search can capture active demand close to a decision. It often produces strong conversion but can become expensive as auctions intensify or budgets move into weaker queries.
Separate brand, non-brand, remarketing and Shopping or product activity. Brand search may receive credit for customers already looking for the company; non-brand activity may be more incremental but carry a higher CAC.
Microsoft Advertising
Microsoft can add profitable search demand where Google’s marginal efficiency has weakened. It normally offers less scale, so judge it as an additional profit pool rather than a replacement based on a lower headline CPC.
Meta and paid social
Paid social can create demand among people who were not actively searching. First-click or last-click reports may understate that role, while platform view-through and retargeting attribution may overstate it.
Separate prospecting, retargeting, existing customers and new customers. Compare customer cohorts and total-store outcomes as spend changes.
Email and SMS
These channels often produce strong efficiency because the audience already knows the brand. Include platform, production, discount and list-acquisition costs, but distinguish retention profit from new-customer acquisition.
Referral and partnership activity
Referrals can create high-trust, high-conversion customers. Include referral payments, partner commission, programme management and discounts. Measure whether referral customers differ in value, retention and sales effort.
Affiliate and influencer marketing
Include commission, product, content, management and discount costs. Promo-code or last-click reports can miss halo effects or credit sales that would have occurred anyway. Use controlled tests where the investment is material.
Content, events and offline activity
These can influence long sales journeys without receiving the final conversion. Use CRM source history, self-reported attribution, coded tests, geographic comparisons and cohort performance rather than relying on last click alone.
Measure customer value by acquisition cohort
A channel that looks unprofitable on the first order may create customers who buy repeatedly, retain longer or expand into higher-value services.
Create cohorts by:
- First acquisition month.
- Original acquisition channel.
- Campaign and offer.
- Product or service first purchased.
- Customer type and geography.
Then track cumulative contribution after 30, 90, 180 and 365 days.
12-month contribution value per customer = Cohort contribution during 12 months ÷ Customers originally acquired
Use contribution, not revenue-only lifetime value.
Example:
| Channel | True CAC | First-order contribution | 12-month contribution before CAC | 12-month contribution after CAC |
| Paid social | £700 | £300 | £2,400 | £1,700 |
| Non-brand search | £850 | £800 | £2,200 | £1,350 |
| Referral | £400 | £650 | £1,500 | £1,100 |
Referral wins on CAC and first-order efficiency. Paid social wins on 12-month contribution after acquisition. The correct budget choice depends on payback constraints, confidence in repeat behaviour and available scale.
Account for product and service mix
A channel can look strong because it sells high-revenue but low-margin products. Another may attract fewer customers who buy more profitable services.
Analyse:
- Revenue and contribution by item or service.
- Average discount.
- Delivery or fulfilment cost.
- Return, refund and cancellation rate.
- Sales commission and servicing cost.
- Subscription or repeat-purchase behaviour.
- Cross-sell and expansion.
Calculate:
Channel contribution after acquisition = Sum of customer-level contribution − Channel acquisition cost
Avoid applying one average margin across a catalogue or service portfolio with materially different economics.
Lead quality and sales performance affect the answer
For a lead-generation business, the channel does not operate independently of sales.
Track by channel:
- Valid and qualified leads.
- Response time and contact rate.
- Meetings and opportunities.
- Proposal rate.
- Lead-to-sale rate.
- Sales cycle.
- Revenue and contribution per lead.
- Loss reason and salesperson.
Expected customer contribution per lead is:
Expected contribution per lead = Contribution per customer × Lead-to-sale conversion rate
If each customer produces £1,000 contribution before acquisition:
- A £20 lead closing at 3% has £30 expected contribution.
- A £60 lead closing at 20% has £200 expected contribution.
The £60 lead costs three times as much but provides more than six times the expected value.
Before blaming a channel, control for lead routing, representative, response time, service mix, territory and sales capacity. A strong source can appear weak when its leads are handled slowly or assigned to an overloaded team.
Attribution does not prove profitability or causality
Attribution decides which touchpoint receives conversion credit. It does not establish whether the channel caused the sale.
A customer might:
- Discover the business through Meta.
- Read an organic article.
- Return through a Google brand advert.
- Open an email.
- Purchase directly.
Different systems and models can assign that customer differently.
Google Analytics describes attribution as assigning credit to ads, clicks and other factors across the path. Its attribution-paths report can show channels that initiate, assist and close key events, along with touchpoints and days to conversion. Google Analytics attribution paths
Use attribution to understand journeys, but use incrementality to estimate causal impact.
Measure incrementality where it matters
An incremental customer is one who would not have been acquired during the period without the channel activity.
Use:
- Randomised user holdouts where available.
- Geographic treatment and control regions.
- Matched-market tests.
- Structured channel or campaign pauses.
- New-customer analysis.
- Total revenue, contribution and blended efficiency changes.
Google describes Conversion Lift as a controlled comparison between people who can see ads and a control group who cannot, with the difference representing conversions caused by advertising. Google Ads Conversion Lift
Then calculate:
Incremental CAC = Channel acquisition cost ÷ Incremental new customers
Incremental contribution profit = Incremental customer contribution − Channel acquisition cost
A channel might claim 100 customers but create only 40 incremental customers. At £20,000 cost, attributed CAC is £200 while incremental CAC is £500.
The incremental figure is more defensible for strategic budget decisions.
Use marginal returns to allocate the next pound
Historic average performance does not reveal saturation.
Marginal CAC = Additional channel cost ÷ Additional new customers
Marginal contribution profit = Additional customer contribution − Additional acquisition cost
Suppose:
- Google’s first £50,000 acquires 100 incremental customers: £500 CAC.
- Its next £20,000 acquires only 20 more: £1,000 marginal CAC.
- Microsoft’s first £20,000 acquires 30: £666.67 CAC.
Google still has the better historic average, but Microsoft is the stronger destination for the next £20,000 if customer value is comparable.
Budget should move toward the best expected marginal contribution—not automatically toward the channel with the best annual average.
Add scale and capacity to profitability
The channel with the best profit per customer may not produce enough customers to reach the growth target. The channel with the highest total profit may be less efficient per customer but much more scalable.
Assess:
- Available audience or search demand.
- Profitable impression-share headroom.
- Creative and content production capacity.
- Sales-team capacity.
- Inventory or delivery limits.
- Cash required during payback.
- Diminishing returns as spend rises.
The best portfolio often combines:
- An efficient foundation such as organic and referral demand.
- Scalable capture through paid search and Shopping.
- Demand creation through paid social, content or partnerships.
- Retention through email, SMS and customer experience.
The aim is not to declare one permanent winner. It is to design a channel mix in which each part plays a measurable commercial role.
A practical channel-profitability dashboard
Report four layers.
1. Channel delivery
- Spend and fully allocated cost.
- Relevant traffic.
- Valid and qualified leads.
- CPL and cost per qualified lead.
2. Customer acquisition
- New customers.
- Lead-to-sale conversion.
- True CAC.
- Sales-cycle length.
- New-customer share.
3. Customer economics
- First-order revenue and contribution.
- Contribution after CAC.
- 6- and 12-month contribution.
- Retention, repeat purchase and cancellation.
- Payback period.
4. Strategic impact
- Assisted journeys.
- Incremental customers and contribution.
- Marginal CAC.
- Total contribution at current scale.
- Forecast contribution from the next budget increase.
Keep attributed, incremental and forecast results labelled separately.
A 90-day evaluation process
Days 1–30: establish comparable data
- Define a new customer and valid lead.
- Allocate media, marketing and sales acquisition costs.
- Connect channel and campaign data to CRM or commerce outcomes.
- Calculate contribution by customer and product or service.
- Separate acquisition, retention and demand-capture activity.
Days 31–60: build cohorts and diagnose
- Compare qualified-lead and close rates.
- Measure true CAC and first-order contribution.
- Review sales handling and lead-routing differences.
- Build 6- and 12-month cohort views where history exists.
- Identify channels most exposed to attribution inflation.
Days 61–90: test and reallocate
- Run an incrementality test on a material, uncertain channel.
- Estimate marginal CAC from recent spend changes.
- Protect profitable activity with available headroom.
- Reduce activity producing volume without contribution.
- Reallocate a controlled budget to the strongest marginal opportunity.
Do not move the entire budget from one month of results. Account for sample size, seasonality, sales-cycle maturity and operational changes.
The practical answer
The most profitable marketing channel is the one that generates the strongest sustainable incremental contribution profit, not the cheapest leads.
Calculate, by channel:
Contribution after acquisition per customer = Customer contribution before acquisition − True CAC
Then assess total and marginal impact:
Total channel contribution after acquisition = Customer contribution generated − Channel acquisition cost
Marginal contribution profit = Additional contribution caused − Additional channel cost
Include new-customer status, lead quality, close rate, sales cost, product or service margin, returns, repeat value, payback and incrementality. Keep acquisition channels separate from retention activity and use attribution-path data to understand, not overclaim, assisted journeys.
There may be several winners: the channel with the lowest CAC, the highest profit per customer, the largest total contribution and the best next-pound return. The strategy is to fund each according to its commercial role and continue scaling only while incremental contribution remains attractive.
Book a Strategy Call
If your channel reports stop at CPL, CPA or platform ROAS, Clubbish can connect acquisition activity with CRM, sales, customer value and contribution profit. We will identify which channels create genuinely profitable customers, where attribution is overstating performance and where the next pound of budget is most likely to produce sustainable growth.