
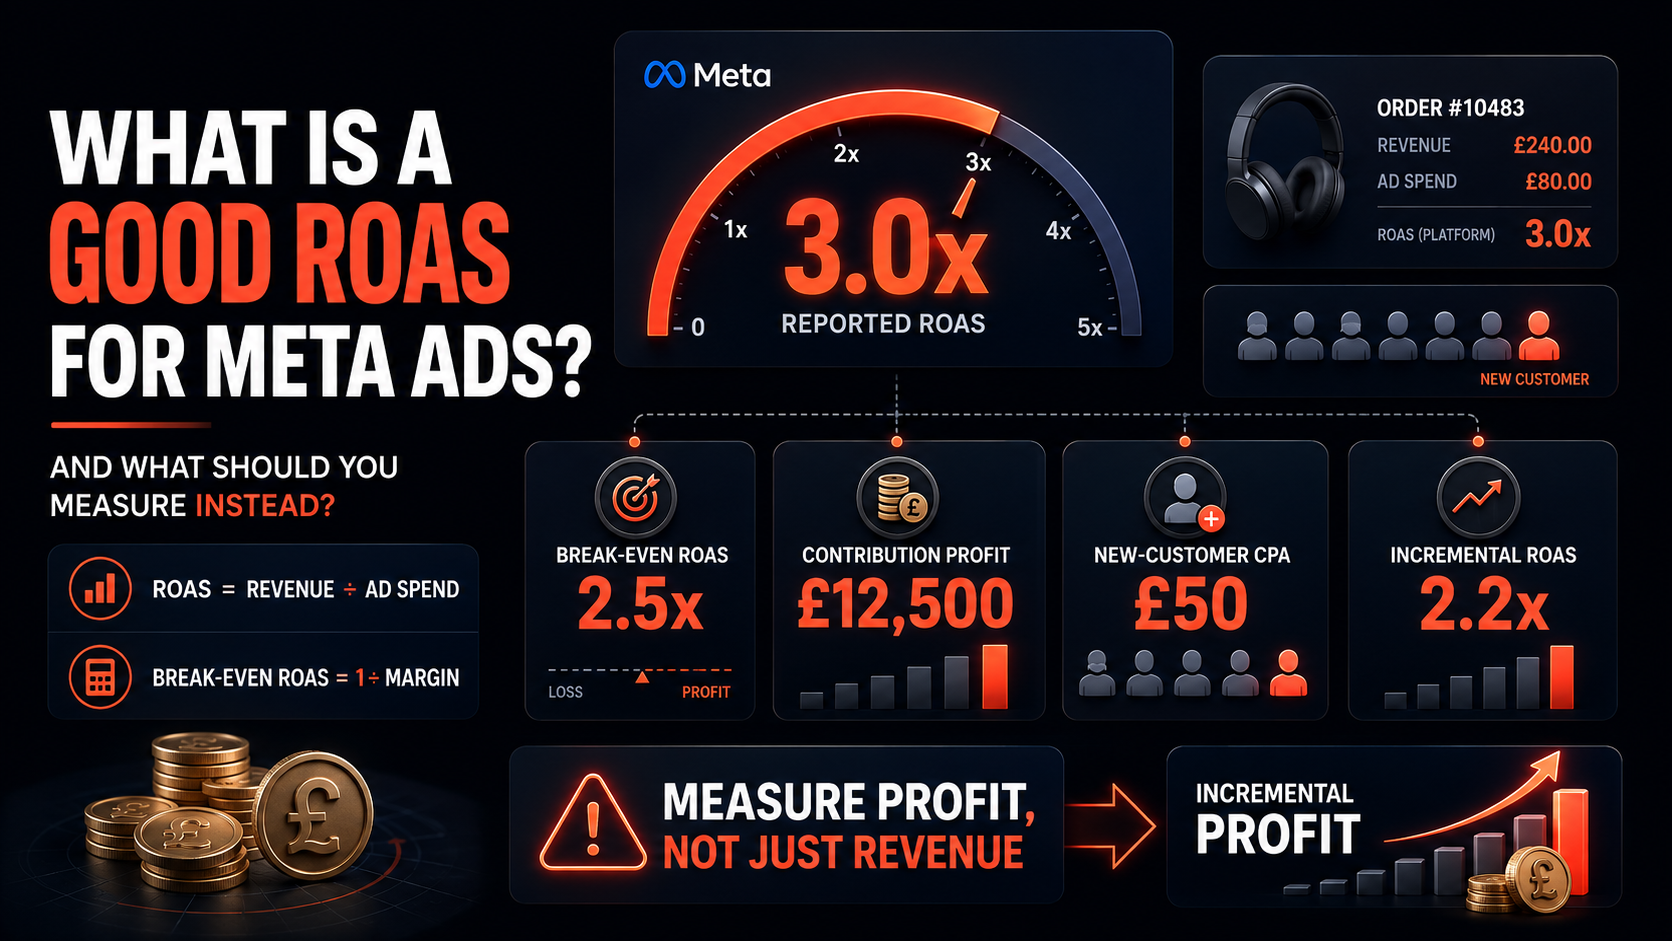
There is no universal “good” ROAS for Meta Ads in e-commerce. A 2x ROAS can be excellent for a high-margin, repeat-purchase brand and unprofitable for a low-margin retailer. A 4x ROAS can also be misleading if Meta is primarily retargeting existing customers or taking credit for purchases that would have happened anyway.
The correct ROAS target is the level that produces acceptable incremental contribution profit after product costs, fulfilment, payment fees, discounts, returns and advertising spend.
For many e-commerce businesses, a reported Meta ROAS somewhere around 1.9x–3x can be commercially viable. That is a directional range, not a target. The decisive question is:
Does the next pound spent on Meta create enough incremental contribution profit and customer value to justify the next pound of budget?
The short answer
Use Meta ROAS as a platform-efficiency indicator, but do not use it as the company’s primary measure of marketing success.
A good Meta ROAS must:
- Exceed the business’s break-even ROAS.
- Leave sufficient contribution after advertising.
- Acquire an acceptable proportion of new customers.
- Produce customers with suitable repeat-purchase value.
- Remain commercially viable after refunds and returns.
- Increase total-store revenue and profit—not just Meta-attributed revenue.
- Continue to work at the margin as spend increases.
- Reflect sales genuinely caused by advertising where incrementality can be measured.
If those conditions are not met, a visually impressive Meta ROAS may still be poor business performance.
What ROAS means
ROAS means return on ad spend:
Meta ROAS = Meta-attributed revenue ÷ Meta ad spend
If Meta reports £30,000 in purchase revenue from £10,000 in advertising spend:
£30,000 ÷ £10,000 = 3x ROAS
The platform is reporting £3 of attributed revenue for each £1 of media spend.
That calculation does not establish that the business made a profit. It also does not prove that Meta caused every attributed order.
What current benchmarks say
Published Meta ROAS benchmarks vary because datasets use different:
- Industries and product categories.
- Account sizes.
- Countries and currencies.
- Attribution windows.
- New-customer definitions.
- Prospecting and retargeting mixes.
- Treatment of refunds and cancelled orders.
- Average versus median calculations.
- Platform-reported versus third-party attribution.
Triple Whale’s 2025 benchmark reporting across nearly 35,000 e-commerce brands places median Meta ROAS at approximately 1.86x. Varos-based benchmark reporting cited by Superscale places median Meta ROAS across industries at approximately 2.19x.
Other published datasets report materially higher figures, illustrating why a single number should never become a universal target.
A practical directional interpretation
| Reported Meta ROAS | Possible interpretation |
|---|---|
| Below 1.5x | Often difficult to sustain on first-order economics unless margins or repeat-purchase value are strong |
| Around 1.5x–2.5x | Common in prospecting-heavy accounts; potentially viable with strong contribution margin or lifetime value |
| Around 2.5x–4x | Often commercially healthy, but still needs incrementality, margin and customer-quality checks |
| Above 4x | Strong reported efficiency, although it may indicate heavy retargeting, brand demand, existing customers or limited scale |
These are contextual bands, not recommendations. A business with a 25% pre-ad contribution margin needs substantially more revenue per pound spent than a business with a 65% margin.
Calculate your break-even ROAS
Your break-even target should come from pre-ad contribution margin:
Break-even ROAS = 1 ÷ pre-ad contribution margin
Pre-ad contribution margin should account for the costs directly associated with an order, such as:
- Cost of goods.
- Inbound freight where appropriate.
- Pick, pack and fulfilment.
- Shipping subsidies.
- Payment-processing fees.
- Discounts.
- Expected refunds and returns.
- Marketplace or transactional fees where relevant.
Suppose an average £100 order leaves £40 after those costs. The pre-ad contribution margin is 40%:
1 ÷ 0.40 = 2.5x break-even ROAS
At 2.5x, advertising consumes the entire £40 available before media. The order contributes nothing towards fixed overheads or profit.
If the company requires £10 contribution after advertising, the maximum acquisition cost becomes £30. On a £100 order:
Target ROAS = £100 ÷ £30 = 3.33x
The commercially required target is therefore 3.33x—not the 1.86x market median and not an arbitrary 4x target.
The same ROAS can mean opposite outcomes
Consider two businesses both reporting 2.5x Meta ROAS.
| Metric | Brand A | Brand B |
| Meta spend | £20,000 | £20,000 |
| Attributed revenue | £50,000 | £50,000 |
| Reported ROAS | 2.5x | 2.5x |
| Pre-ad contribution margin | 60% | 30% |
| Contribution before ads | £30,000 | £15,000 |
| Contribution after ads | £10,000 | -£5,000 |
Brand A generates £10,000 contribution after media. Brand B loses £5,000 before fixed overheads.
The same Meta ROAS is strong for one company and unsustainable for the other.
Why a 4x Meta ROAS may still be misleading
A high Meta ROAS can result from excellent advertising, but it can also be inflated by the structure of the campaign and the platform’s attribution model.
Common reasons include:
- Retargeting website visitors already close to purchase.
- Advertising to past customers who would have returned anyway.
- Promotional demand generated by email, influencers, PR or Google.
- View-through attribution where a person saw—but did not click—an ad before purchasing.
- Overlap between Meta, Google, email, organic and direct reporting.
- A short period with unusually strong seasonal demand.
- Under-spending in a small, highly efficient audience.
A retailer could report 5x ROAS on £2,000 spend while producing £4,000 contribution after advertising. Another campaign could report 3x on £100,000 spend and produce £50,000 contribution. The lower ROAS may be much more valuable to the business.
Prospecting and retargeting should not share one interpretation
Retargeting normally produces higher reported ROAS because it reaches people who have already visited, viewed a product, added to basket or purchased previously.
Prospecting has a harder job: creating demand among people who may not know the brand.
| Campaign role | Expected behaviour | Main commercial question |
| Prospecting | Lower immediate ROAS, higher new-customer potential | Does it acquire incrementally valuable customers? |
| Retargeting | Higher reported ROAS, greater attribution overlap | How many of these customers would have purchased anyway? |
| Existing-customer activity | Strong conversion rate and repeat revenue | Is paid media needed to generate the repeat purchase? |
| Product launch | Lower early efficiency and limited history | Is it creating future demand and customer value? |
Do not cut prospecting solely because retargeting reports a higher ROAS. Doing so can reduce the supply of new customers entering the funnel, eventually weakening retargeting as well.
Why ROAS is limited
Meta ROAS does not necessarily measure:
- Profit.
- Incremental revenue.
- Incremental customers.
- Product margin.
- Fulfilment costs.
- Returns and cancellations.
- New versus returning customers.
- Repeat-purchase value.
- Cross-channel attribution overlap.
- The marginal return from additional spend.
- Cash payback timing.
ROAS is useful for diagnosing campaign efficiency when comparisons use consistent attribution settings, dates and conversion definitions. It should not become the sole basis for investment decisions.
Measure contribution profit instead
The most important companion or replacement metric is contribution profit after advertising:
Contribution profit = revenue − COGS − fulfilment − payment fees − discounts − returns − ad spend
Use it by:
- Campaign.
- Product category.
- Margin band.
- New versus returning customer.
- Country.
- Device where useful.
- Creative theme or offer where data supports it.
Worked example
| Metric | Campaign A | Campaign B |
| Spend | £10,000 | £25,000 |
| Revenue | £40,000 | £75,000 |
| ROAS | 4x | 3x |
| Pre-ad contribution margin | 30% | 50% |
| Contribution before ads | £12,000 | £37,500 |
| Contribution after ads | £2,000 | £12,500 |
Campaign B has the lower ROAS but produces more than six times the contribution profit after advertising.
If management optimised only towards ROAS, it could move budget away from the campaign generating substantially more cash contribution.
Measure new-customer economics
Separate customer acquisition from revenue generated through existing customers.
Track:
- New-customer CPA.
- New-customer ROAS.
- Percentage of orders from new customers.
- First-order contribution.
- Repeat-purchase rate.
- Realised customer lifetime value.
- Predicted customer lifetime value where reliable.
- Payback period.
New-customer CPA
New-customer CPA = Meta spend allocated to acquisition ÷ new customers acquired
If £30,000 in prospecting spend produces 1,000 Meta-attributed orders but only 600 are first-time buyers:
£30,000 ÷ 600 = £50 new-customer CPA
The general platform CPA may be £30, but the customer-acquisition cost is £50.
That distinction can materially change the profitability conclusion.
Use lifetime value carefully
A lower first-order ROAS can be rational when customers purchase repeatedly and the business has dependable retention data.
For example:
- First order revenue: £60.
- First-order contribution before ads: £24.
- New-customer CPA: £35.
- First-order contribution after ads: -£11.
- Twelve-month contribution from repeat purchases: £45.
- Total twelve-month contribution after acquisition: £34.
The initial order loses money, but the customer becomes profitable within the required payback period.
However, avoid justifying poor campaigns with aspirational lifetime value. Use realised cohort data segmented by acquisition source, customer type and time period. A customer acquired through a deep discount may not repeat like an organically acquired customer.
Measure blended MER
Blended marketing efficiency ratio is:
MER = total business revenue ÷ total marketing spend
If the company generates £500,000 revenue from £100,000 total marketing investment:
£500,000 ÷ £100,000 = 5x MER
MER is not a perfect causal measure, but it prevents each advertising platform from claiming the same sale independently.
Monitor how total business performance changes as Meta spend changes.
| Period | Meta spend | Total marketing spend | Store revenue | MER |
| Month 1 | £40,000 | £80,000 | £480,000 | 6x |
| Month 2 | £60,000 | £100,000 | £520,000 | 5.2x |
| Month 3 | £80,000 | £120,000 | £535,000 | 4.46x |
Revenue grows, but each additional block of spend produces progressively less total business return. This may be acceptable if contribution profit still increases, but the platform ROAS alone will not reveal it.
Measure incrementality
Attribution answers:
Which advertising interaction received credit?
Incrementality answers:
Which sales would not have happened without Meta advertising?
Meta’s Conversion Lift methodology is designed to measure incremental impact by comparing outcomes between people eligible to see advertising and a comparable holdout group.
The core calculation is:
Incremental conversions = conversions in exposed group − expected conversions without exposure
Then calculate:
Incremental ROAS = incremental revenue ÷ Meta spend
For a stronger commercial view:
Incremental contribution profit = contribution generated by incremental sales − Meta spend
Attributed versus incremental example
Suppose Meta reports:
- Ad spend: £50,000.
- Attributed revenue: £200,000.
- Reported ROAS: 4x.
A controlled test estimates that only £110,000 of the revenue was incremental:
£110,000 ÷ £50,000 = 2.2x incremental ROAS
The campaign did create value, but its causal return is materially lower than the Ads Manager figure.
This does not mean platform attribution is useless. It means attribution and incrementality answer different questions.
Measure marginal ROAS
Average ROAS can conceal diminishing returns.
Marginal ROAS = additional revenue produced by extra spend ÷ additional spend
Suppose:
| Monthly Meta spend | Revenue | Average ROAS | Additional revenue | Marginal ROAS |
| £10,000 | £35,000 | 3.5x | — | — |
| £15,000 | £43,000 | 2.87x | £8,000 | 1.6x |
| £20,000 | £48,000 | 2.4x | £5,000 | 1x |
At £20,000 spend, the account still reports a respectable 2.4x average ROAS. The last £5,000 generated only £5,000 revenue—a 1x marginal return before product costs.
The next budget decision should be guided by the marginal result, not the historic average.
Measure payback period
Payback period shows how long it takes for the contribution generated by a customer to recover the acquisition cost.
This matters when a brand intentionally accepts weak first-order economics in exchange for repeat purchases.
Report customer cohorts at:
- First purchase.
- 30 days.
- 60 days.
- 90 days.
- Six months.
- Twelve months where relevant.
A business with limited cash may require first-order or 30-day payback. A well-capitalised subscription brand may accept six months. Neither policy is inherently correct; it must match cash flow, retention reliability and strategic objectives.
Use a four-layer measurement framework
1. Platform efficiency
Track:
- Spend.
- CPM.
- Reach and frequency.
- CTR.
- CPC.
- Landing-page views.
- Conversion rate.
- CPA.
- Attributed revenue.
- Reported ROAS.
These metrics explain what happens inside Meta’s delivery system.
2. Commercial economics
Track:
- Gross margin.
- Pre-ad contribution margin.
- Contribution profit after ads.
- AOV.
- Discount rate.
- Fulfilment cost.
- Return and cancellation rate.
- Break-even ROAS.
- Payback period.
These metrics determine whether the sales create cash contribution.
3. Customer quality
Track:
- New-customer share.
- New-customer CPA.
- Repeat-purchase rate.
- Customer lifetime value.
- Time to second purchase.
- Retention by acquisition cohort.
- High-value customer rate.
These metrics show whether Meta is acquiring valuable customers rather than transactions alone.
4. Business impact
Track:
- Total-store revenue.
- Total contribution profit.
- Blended MER.
- Incremental conversions.
- Incremental revenue.
- Incremental contribution profit.
- Marginal ROAS.
- Marginal contribution return.
These metrics determine whether more Meta investment improves the company, rather than Meta’s dashboard.
Tracking quality determines optimisation quality
Meta’s value-optimisation tools can prioritise higher-value conversions, but they depend on the quality of the values and customer signals provided.
Ensure:
- Purchase events fire once per completed transaction.
- Revenue values and currency are correct.
- Browser and server events are deduplicated correctly.
- Test orders are excluded.
- Refunds and cancellations are accounted for in business reporting.
- Product and customer values reflect the commercial objective.
- New and returning customers are distinguishable in the commerce database.
- Attribution settings remain consistent when comparing periods.
If every order is passed with the same value, the system cannot distinguish a £30 low-margin basket from a £300 high-margin order.
How to set a practical Meta target
Step 1: calculate the financial floor
Calculate break-even ROAS by margin band or product category.
Step 2: add required contribution
Determine how much profit or overhead contribution each sale must leave after advertising.
Step 3: separate campaign roles
Set different expectations for prospecting, retargeting, retention and product launches.
Step 4: account for customer value
Use realised repeat-purchase data and define the acceptable payback period.
Step 5: test incrementality
Use Conversion Lift, holdouts or well-designed geographic experiments where volume and platform eligibility allow.
Step 6: evaluate the next pound
Increase spend only while marginal incremental contribution meets the required return.
A board-level Meta scorecard
| Measure | Current month | Previous month | Same month last year | Target |
| Meta spend | ||||
| Reported ROAS | ||||
| New-customer CPA | ||||
| New-customer share | ||||
| Contribution profit after Meta | ||||
| Return rate | ||||
| 90-day customer value | ||||
| Total-store revenue | ||||
| Blended MER | ||||
| Incremental ROAS | ||||
| Marginal contribution return |
The scorecard should show absolute pounds as well as ratios. A declining ROAS can accompany rising total profit, while a rising ROAS can result from cutting spend and shrinking the business.
Common Meta ROAS mistakes
Using 4x as a universal target
The correct target comes from margin, customer value and required contribution—not a rule repeated across the industry.
Comparing different attribution windows
A 7-day-click result cannot be compared fairly with a 1-day-click result without acknowledging the methodological change.
Blending prospecting and retargeting
Warm audiences can make overall ROAS look stronger while obscuring weak new-customer acquisition.
Ignoring refunds and returns
High-return categories can report strong purchase revenue that later disappears.
Optimising towards revenue instead of profit
Revenue-weighted delivery can favour high-value orders that have weak margins.
Scaling from average ROAS
The average describes previous spend. Marginal return determines whether the next budget increase is viable.
Crediting Meta for every reported conversion
Platform attribution is not proof that the ad caused the purchase.
Cutting campaigns with lower ROAS but higher profit
A scalable campaign can generate more contribution pounds despite a weaker percentage return.
The practical answer
So, what is a good ROAS for Meta Ads in e-commerce—and what should you measure instead?
Current benchmark evidence places median Meta ROAS around 1.86x–2.19x, depending on the dataset and market definition. For many brands, a reported Meta ROAS of approximately 1.9x–3x can be viable. None of these figures determines whether your account is profitable.
A good Meta ROAS is one that clears the business’s break-even threshold, leaves acceptable contribution after advertising, acquires valuable new customers and continues to create incremental profit as spend increases.
Measure ROAS alongside:
- Contribution profit.
- New-customer CPA and ROAS.
- Lifetime value and payback.
- Blended MER.
- Incremental revenue and profit.
- Marginal ROAS and contribution return.
The standard that matters is not whether Ads Manager displays 4x. It is whether the next pound spent on Meta creates enough additional profit and customer value to justify the investment.
Frequently asked questions
Is a 2x Meta ROAS good for e-commerce?
It can be. A 2x ROAS may be profitable for a high-margin brand with strong repeat purchasing and unprofitable for a low-margin retailer. Calculate break-even ROAS first.
Is a 4x Meta ROAS good?
It is a strong reported result in many accounts, but check whether it comes from retargeting, existing customers, limited spend or attribution overlap. Profit and incrementality still matter.
What is the average Meta Ads ROAS?
Recent benchmark reporting places median Meta ROAS at approximately 1.86x–2.19x, although results vary substantially by category, attribution and campaign mix.
What should replace ROAS?
Do not necessarily remove ROAS. Use it alongside contribution profit, new-customer economics, blended MER, incrementality and marginal return.
How do I calculate break-even ROAS?
Divide one by the pre-ad contribution margin expressed as a decimal. A 40% margin produces a 2.5x break-even ROAS.
Why does Meta report more revenue than GA4 or Shopify attribution reports?
The systems use different attribution rules, identity signals, lookback windows and treatment of views and clicks. Reconcile them against actual store transactions rather than expecting identical channel totals.
Should retargeting have a higher ROAS target?
It will often report higher ROAS because the audience is warmer. Evaluate whether the campaign creates incremental sales before using its result to justify more budget.
How often should Meta profitability be reviewed?
Monitor delivery weekly, review commercial performance monthly and assess incrementality and customer cohorts quarterly or when material budget changes justify a new test.
Is Meta reporting revenue—or creating profitable growth?
Clubbish helps e-commerce teams assess Meta Ads through contribution profit, customer acquisition, incrementality and scalable marginal return.
If the dashboard reports a strong ROAS but the business is not seeing the expected cash contribution, book a marketing strategy consultation with Clubbish.