
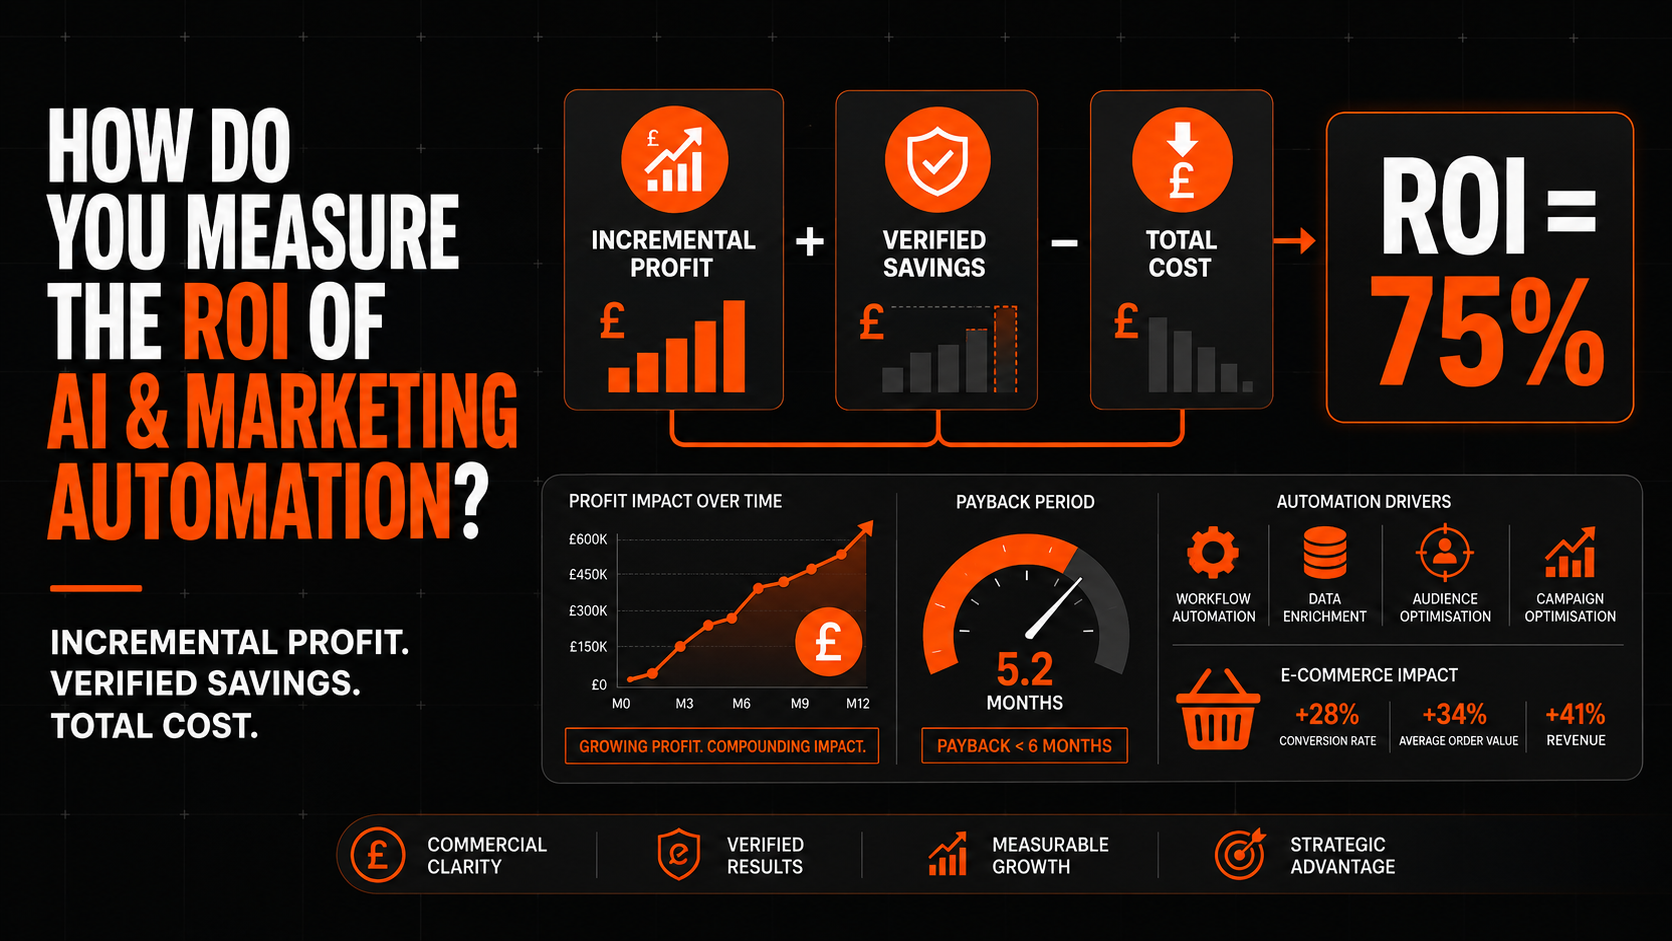
How do you measure the ROI of AI and marketing automation? Measure the incremental contribution profit and verified cost savings created by the system, subtract its full implementation and operating costs, and divide the net benefit by those costs.
The crucial words are incremental, verified and full. Revenue that would have occurred without the automation is not a defensible return. Employee time that has not been converted into lower cost, greater capacity or higher-value output is not a realised saving. A calculation that excludes integration, data, monitoring, human review and failure costs is not the full investment.
The practical formula is:
AI and automation ROI = (Incremental contribution profit + Verified cost savings − Total AI and automation cost) ÷ Total AI and automation cost × 100
That calculation should sit inside a wider measurement framework covering customer outcomes, operational performance, AI quality, privacy, security and business risk. A system that creates short-term revenue while increasing complaints, returns, errors or compliance exposure may have negative long-term value.
The short answer
To measure the ROI of AI and marketing automation reliably:
- Define the specific process and commercial outcome.
- Record a trustworthy pre-automation baseline.
- Calculate every implementation and running cost.
- Use a holdout, control or credible counterfactual.
- Measure incremental revenue rather than attributed revenue.
- Convert incremental revenue into contribution profit.
- Verify whether claimed time savings create real financial value.
- Monitor quality, customer and risk guardrails.
- Calculate ROI and payback over an appropriate period.
- Scale only while marginal benefit remains above marginal cost.
Do not use the number of messages, assets, recommendations or completed tasks as proof of return. Those are activity measures. The business outcome must be expressed in profit, realised capacity, customer value or risk reduction.
Start with the business outcome—not the AI capability
An ROI model is only useful when the proposed automation has a defined purpose.
Weak objective:
“Use AI to improve marketing productivity.”
Stronger objective:
“Reduce weekly campaign-report preparation from 20 hours to five hours while maintaining data accuracy, then redeploy the recovered capacity into conversion testing.”
Another stronger objective:
“Increase incremental repeat-purchase contribution profit from lapsed customers by £8,000 per month without increasing unsubscribe or complaint rates beyond the agreed threshold.”
The audit should document:
- The exact task, decision or workflow being changed.
- The commercial or operational problem.
- The customer or employee affected.
- Current performance and cost.
- The expected improvement.
- The measurement method.
- The owner of the result.
- The point at which the system will be expanded, redesigned or stopped.
If the proposed benefit cannot be expressed clearly before implementation, it will be difficult to prove afterwards.
Establish a reliable baseline
Before switching on an AI or automation system, record how the current process performs.
Depending on the use case, the baseline may include:
- Revenue per eligible customer.
- Conversion rate.
- Average order value.
- Customer-acquisition cost.
- Contribution margin and profit.
- Repeat-purchase rate.
- Email or SMS revenue per recipient.
- Customer-service contacts and resolution time.
- Feed errors and product disapprovals.
- Employee and agency hours.
- Campaign launch time.
- Error and rework rates.
- Returns, refunds and complaints.
- Unsubscribe and opt-out rates.
- Manual overrides.
Use enough history to reflect seasonality, promotional patterns, stock changes and demand variation. For a highly seasonal retailer, the previous four weeks may be a poor baseline. Compare like with like and retain explanatory variables such as:
- Promotions and discount levels.
- Product availability.
- Pricing and delivery changes.
- Media spend.
- Competitor activity where known.
- Website and checkout releases.
- New product launches.
- Economic or category-demand changes.
An unusually weak month before implementation and an unusually strong month afterwards can make an ineffective system appear valuable.
Use the right ROI formula
A basic business ROI calculation is:
ROI = (Financial benefit − Total investment) ÷ Total investment × 100
For AI and marketing automation, define financial benefit carefully:
Financial benefit = Incremental contribution profit + Verified cost savings + Quantified risk reduction
Quantified risk reduction should be used cautiously. It is appropriate where the business has credible historical evidence—for example, fewer feed errors preventing a measurable amount of wasted ad spend. Do not invent large theoretical values to make the investment case look stronger.
The recommended primary calculation is therefore:
AI and automation ROI = (Incremental contribution profit + Verified cost savings − Total cost) ÷ Total cost × 100
If the net benefit is £40,000 and the total cost is £20,000:
ROI = £40,000 ÷ £20,000 × 100 = 200%
That means the project returned £2 of net benefit beyond the recovered investment for every £1 invested.
Separate revenue from profit
Revenue is useful for diagnosing performance, but it does not establish commercial value.
Convert incremental revenue into contribution profit after the costs affected by the additional sale:
Incremental contribution profit = Incremental revenue − Cost of goods − Fulfilment − Payment fees − Discounts − Returns − Incremental marketing cost
The appropriate cost definition depends on the business. A retailer may also need to include:
- Packaging.
- Marketplace or platform fees.
- Customer-service cost.
- Warranty or replacement allowance.
- International shipping and duties.
- Subscription incentives.
- Promotional gifts.
An AI recommendation engine could increase revenue by promoting products with low margins or high return rates. An automated win-back programme might drive orders only by offering discounts to customers who would have purchased at full price. An AI bidding system may produce more attributed sales while spending disproportionately on existing customers.
If contribution profit does not improve, higher revenue may not represent a successful investment.
Prove incrementality
The most common measurement error is treating attributed revenue or correlation as causal return.
A customer may receive an automated email, view an AI-selected product recommendation and then purchase. That does not prove the automation caused the order. The same customer may have purchased through direct traffic, organic search, paid search or an existing brand relationship.
Use the strongest credible counterfactual available:
- Randomised holdout: Keep a representative group of eligible customers out of the automation.
- A/B test: Randomly assign customers, pages or experiences to control and treatment.
- Geographic test: Introduce the system in selected matched locations.
- Phased rollout: Deploy to comparable stores, product groups or teams at different times.
- Matched cohort: Compare similar customer or product groups when randomisation is not practical.
- Forecast versus actual: Build a seasonally adjusted baseline and measure performance above it.
Calculate:
Incremental revenue = Treatment revenue − Expected revenue without the automation
Then:
Incremental ROAS = Incremental revenue ÷ Automation-related media or message cost
For investment decisions, use incremental contribution profit rather than incremental revenue wherever the data allows.
The UK government’s 2026 guidance on evaluating AI interventions describes impact evaluation as the systematic assessment of whether, to what extent, how and why an intervention caused its intended outcomes. Although written for public-sector evaluation, that causal principle is directly relevant to commercial AI projects. UK Government
Worked example: attributed revenue versus real ROI
An automated e-commerce win-back journey reports £80,000 of attributed revenue during a quarter.
A randomised holdout shows:
- Customers receiving the journey generated £80,000.
- The equivalent expected revenue without the journey was £55,000.
- Incremental revenue was therefore £25,000.
The incremental revenue has:
- £10,000 cost of goods and fulfilment.
- £2,500 in discounts, fees and expected returns.
- £2,500 in additional email, media and operational cost.
Therefore:
Incremental contribution profit = £25,000 − £10,000 − £2,500 − £2,500 = £10,000
The automation also creates £4,000 of verified staff-capacity value during the quarter. The allocated quarterly technology, implementation and monitoring cost is £8,000.
Net benefit = £10,000 + £4,000 − £8,000 = £6,000
Automation ROI = £6,000 ÷ £8,000 × 100 = 75%
The dashboard reported £80,000 of revenue, but the commercially defensible result is £10,000 of incremental contribution profit, £4,000 of verified capacity and a 75% quarterly ROI after allocated costs.
Measure cost savings honestly
AI and automation frequently promise productivity gains. The most common evidence is “hours saved,” but hours do not automatically become profit.
A time saving becomes a verified financial benefit when it enables:
- Lower employee, contractor or agency cost.
- Avoided recruitment.
- Increased output without equivalent headcount growth.
- Reduced overtime.
- Faster campaign launches that create additional profit.
- More commercially useful tests.
- Fewer errors and less rework.
- Greater customer-service capacity.
- Reallocation to demonstrably higher-value work.
Calculate:
Verified capacity value = Productive hours genuinely redeployed or removed × Fully loaded hourly cost
The fully loaded cost should include salary, employer costs and appropriate overhead—not merely the employee’s hourly wage.
If an AI assistant saves a marketing manager five hours each week but those hours disappear into meetings or additional low-value administration, report the time saving as operational capacity, not realised cash return.
Use three separate categories:
| Benefit type | Meaning | Financial treatment |
|---|---|---|
| Cash saving | Cost is genuinely removed | Include in ROI |
| Avoided cost | Future recruitment or outsourcing is avoided | Include with documented evidence |
| Capacity created | Time is available but not yet monetised | Report separately until redeployed |
This prevents theoretical productivity from being presented as bankable profit.
Include the full cost of ownership
The licence fee is rarely the complete investment.
One-off costs
- Process discovery and workflow design.
- Data cleansing and preparation.
- Integration and implementation.
- Security and privacy assessment.
- Prompt, rule and model configuration.
- Testing and quality assurance.
- Employee and agency training.
- Change management.
- Legal and procurement review.
Recurring costs
- Software subscriptions.
- API and model usage.
- Cloud, storage and data processing.
- Additional email, SMS or media cost.
- Human review and approvals.
- Monitoring and maintenance.
- Vendor support.
- Security and compliance review.
- Model or workflow updates.
- Error correction and customer remediation.
Exit and failure costs
- Contract termination.
- Data export or migration.
- Replacement implementation.
- Business interruption.
- Incorrect discounts or refunds.
- Wasted advertising spend.
- Customer complaints and compensation.
- Content correction or withdrawal.
- Reputational damage where it can be estimated responsibly.
Calculate a base case, downside case and upside case. A project that is attractive only under optimistic assumptions is not a robust investment.
Calculate payback period
ROI shows efficiency; payback shows how long capital remains at risk.
Payback period in months = Initial implementation cost ÷ Average monthly incremental profit and verified savings
If implementation costs £60,000 and the system produces £10,000 in monthly incremental profit and verified savings:
Payback period = £60,000 ÷ £10,000 = 6 months
The appropriate maximum payback depends on:
- Contract length.
- Technology obsolescence risk.
- Data and integration complexity.
- Confidence in the benefit.
- Customer or regulatory risk.
- Cash-flow constraints.
- Whether the system creates a durable capability.
A simple low-risk workflow may need a short payback. A larger customer-data or personalisation programme may reasonably require a longer horizon, but it also demands stronger evidence and governance.
Measure marginal ROI as the programme scales
Average ROI can remain positive while the next stage of investment is unprofitable.
Calculate:
Marginal ROI = Additional net benefit from expansion ÷ Additional investment × 100
For example, the first £20,000 of automation investment may address the easiest high-volume workflows and generate a 150% ROI. The next £40,000 may target less frequent, more complex tasks and generate only 10%.
Leadership should ask:
“Will the next pound invested create more incremental contribution profit or verified saving than the next best use of that pound?”
This is particularly important when expanding:
- Personalisation to smaller segments.
- AI creative production beyond proven formats.
- Customer-service automation into complex enquiries.
- Automated media optimisation across more accounts.
- AI agents into broader multi-step workflows.
Do not scale because average historic performance looks attractive. Scale while marginal performance remains above the commercial threshold.
Use a balanced measurement scorecard
Financial ROI should be the primary investment measure, but operational, customer and risk metrics explain whether the result is sustainable.
| Measurement layer | Useful metrics |
| Financial | Incremental contribution profit, ROI, payback, verified savings and marginal ROI |
| Marketing | Conversion rate, AOV, CPA, new-customer share, repeat purchase and customer lifetime value |
| Operational | Hours saved, processing time, launch speed, error rate and manual interventions |
| Customer | Satisfaction, complaints, unsubscribes, returns, repeat contacts and resolution time |
| AI quality | Accuracy, relevance, unsupported output, drift, bias and override rate |
| Risk | Privacy incidents, unauthorised access, policy breaches and failed actions |
Do not combine these into one opaque score. The board should be able to see whether profit improved at the expense of customer experience, quality or control.
Measure AI quality separately from financial return
A system can produce an apparently positive financial result while generating unreliable output that creates future risk.
Test:
- Recommendation accuracy.
- Product availability and suitability.
- Price and promotion accuracy.
- Factual correctness.
- Brand compliance.
- Customer-segment accuracy.
- Response quality.
- Bias across relevant groups.
- Data leakage.
- Security and access control.
- Performance with missing or unusual data.
- Human override and rollback.
NIST’s AI Risk Management Framework organises risk work around Govern, Map, Measure and Manage. Its measurement guidance recommends selecting appropriate methods, defining acceptable performance limits, detecting errors and testing whether a system is fit for purpose. NIST AI Resource Center
NIST also identifies validity, reliability, safety, security, transparency, explainability, privacy and fairness as important characteristics of trustworthy AI. NIST
Track:
- Percentage of outputs accepted without change.
- Correction time.
- Error severity.
- False-positive and false-negative rates where relevant.
- Escalation and override rate.
- Customer complaints caused by the system.
- Incidents by workflow, model and version.
If employees constantly correct the system, include that review and rework in the ROI calculation.
Include privacy, security and compliance outcomes
AI ROI is risk-adjusted. A system that creates £50,000 of short-term benefit but exposes customer data or makes uncontrolled high-impact decisions is not a successful investment.
For UK e-commerce businesses, assess:
- The lawful basis for personal-data processing.
- Transparency to customers.
- Data minimisation.
- Vendor and sub-processor access.
- Retention and deletion.
- International transfers.
- Profiling and direct-marketing rights.
- Automated decisions with legal or similarly significant effects.
- Human intervention and contestability where required.
- Whether a Data Protection Impact Assessment is needed.
The ICO provides an AI and data-protection risk toolkit to help organisations assess risks to people’s rights and freedoms. ICO
The UK government’s AI Management Essentials material also asks whether organisations monitor systems for errors and expected performance, define risk thresholds and establish conditions under which development or use should stop. UK Government
These controls are not separate from ROI. Monitoring, review and remediation cost money, while strong controls reduce the probability and impact of failure.
Choose the right measurement period
Different automations create value over different timescales.
- Reporting and workflow automation: Measure after enough operational cycles to establish stable time and error savings.
- Customer-journey automation: Measure after sufficient eligible customers and conversions accumulate.
- Conversion optimisation: Run until the result can be separated from normal variation.
- Retention and lifetime value: Follow cohorts through the expected repurchase and payback period.
- Creative automation: Measure production efficiency and the commercial impact of approved tests.
- Customer service: Measure resolution, repeat contact and customer outcomes over several demand cycles.
- AI bidding or allocation: Evaluate marginal contribution profit as spend and demand change.
Do not end measurement after the first positive result. Performance can decline because of:
- Novelty wearing off.
- Audience or creative fatigue.
- Model drift.
- Product and customer mix changing.
- Vendor model updates.
- Employees bypassing the intended workflow.
- Data quality deteriorating.
Report 30-, 90-, 180- and 365-day results where appropriate. A project may pass an early operational checkpoint while still needing a longer window for retention or customer-value evidence.
Build decision rules before launch
Define success and failure before seeing the results.
Document:
- Minimum incremental contribution profit.
- Minimum verified cost saving.
- Maximum acceptable total cost.
- Maximum payback period.
- Minimum accuracy or acceptance rate.
- Maximum error severity and frequency.
- Maximum complaint, unsubscribe or return-rate increase.
- Required privacy and security controls.
- Conditions for expansion.
- Conditions for rollback.
Example:
Continue the automation if it generates at least £5,000 of incremental monthly contribution profit, achieves payback within six months, keeps material error rate below 1% and does not increase complaints or unsubscribes beyond the agreed tolerance.
The figures are illustrative. Each business should set thresholds that reflect its volume, margin, customer promise and risk appetite.
Predefined rules prevent the project team from declaring success because one favourable metric improved while more important measures deteriorated.
Reporting ROI to senior stakeholders
A board-level AI and automation report should answer:
- What process changed?
- What was the baseline?
- How was incremental impact estimated?
- What financial benefit was created?
- Which benefits are cash, avoided cost or unconverted capacity?
- What did implementation and operation cost?
- What is the net ROI and payback period?
- What happened to customers, quality and risk?
- What manual intervention remains?
- Should the business scale, maintain, redesign or stop?
A concise scorecard could show:
| Measure | Baseline | Current | Incremental/verified result | Threshold |
| Contribution profit | £100,000 | £118,000 | £12,000 after controls | £10,000 |
| Verified cost saving | £0 | £6,000 | £6,000 | £5,000 |
| Total automation cost | £0 | £10,000 | £10,000 | £12,000 maximum |
| Net ROI | — | 80% | 80% | 50% |
| Material error rate | 0% | 0.4% | 0.4% | Below 1% |
| Complaint rate | 0.7% | 0.7% | No increase | No material increase |
Avoid leading with messages generated, prompts completed or employee logins. Those can help explain adoption but do not establish commercial return.
A practical 90-day measurement plan
Days 1–30: baseline and design
- Define the process, owner and intended outcome.
- Record financial, operational, customer and quality baselines.
- Map all one-off and recurring costs.
- Select the control, holdout or counterfactual method.
- Define success, risk and rollback thresholds.
- Confirm data, consent, security and tracking readiness.
Days 31–60: controlled implementation
- Launch with a limited audience, workflow or product group.
- Keep the control group protected.
- Record system output, human review and corrections.
- Reconcile platform data with commerce and finance records.
- Monitor complaints, errors, security and customer outcomes.
- Avoid unrelated changes that could obscure the result.
Days 61–90: evaluate and decide
- Calculate incremental revenue and contribution profit.
- Verify cash, avoided-cost and capacity benefits separately.
- Calculate total cost, ROI and payback.
- Review quality and risk guardrails.
- Analyse marginal benefit of the next investment stage.
- Scale, maintain, redesign or stop based on predefined rules.
Frequently asked questions
What is a good ROI for AI and marketing automation?
There is no universal benchmark. The required return depends on implementation risk, payback period, confidence in the evidence and alternative uses of capital. Compare the project with the business’s normal investment hurdle and the next-best opportunity.
Should hours saved be included in ROI?
Only include hours as a financial benefit when they reduce cost, avoid recruitment or are demonstrably redeployed into valuable output. Otherwise, report them as capacity created.
Can platform-attributed revenue be used?
Use it as an operational metric, not proof of incremental value. A holdout, experiment or credible counterfactual is needed to estimate the revenue that would not have occurred without the automation.
How do you measure ROI when the benefit is better customer experience?
Measure customer satisfaction, repeat contact, complaints, retention and lifetime value. Convert these into financial value only where the relationship is evidence-based; otherwise report them as important guardrail or outcome metrics.
How often should AI ROI be reviewed?
Monitor operational and risk indicators continuously or weekly where appropriate. Review commercial performance monthly and make investment decisions over a period suited to the use case, such as quarterly for acquisition or longer for retention and lifetime value.
What if the AI system has positive ROI but poor quality?
Do not scale automatically. Determine whether tighter controls, better data or human review can correct the problem economically. If material customer, legal, security or brand risks remain outside tolerance, redesign or stop the system.
The practical answer
The ROI of AI and marketing automation is not the number of tasks completed, messages sent, assets generated or hours theoretically saved. It is the incremental contribution profit and verified cost saving created after all technology, implementation, people, customer and risk costs have been included.
Start with a reliable baseline, use a control or credible counterfactual, separate attributed revenue from incremental revenue, convert the result into contribution profit and distinguish cash savings from unused capacity. Then monitor customer outcomes, AI quality, privacy and security to ensure the return is sustainable.
The final investment question is:
Does the next pound invested in this AI or automation system create more risk-adjusted incremental value than the next-best use of that pound?
Book a Strategy Call
If you need to establish whether AI and marketing automation can create a measurable commercial return, Clubbish can audit your current processes, data, technology costs and measurement approach—then build a prioritised roadmap focused on incremental contribution profit and verified efficiency gains.