
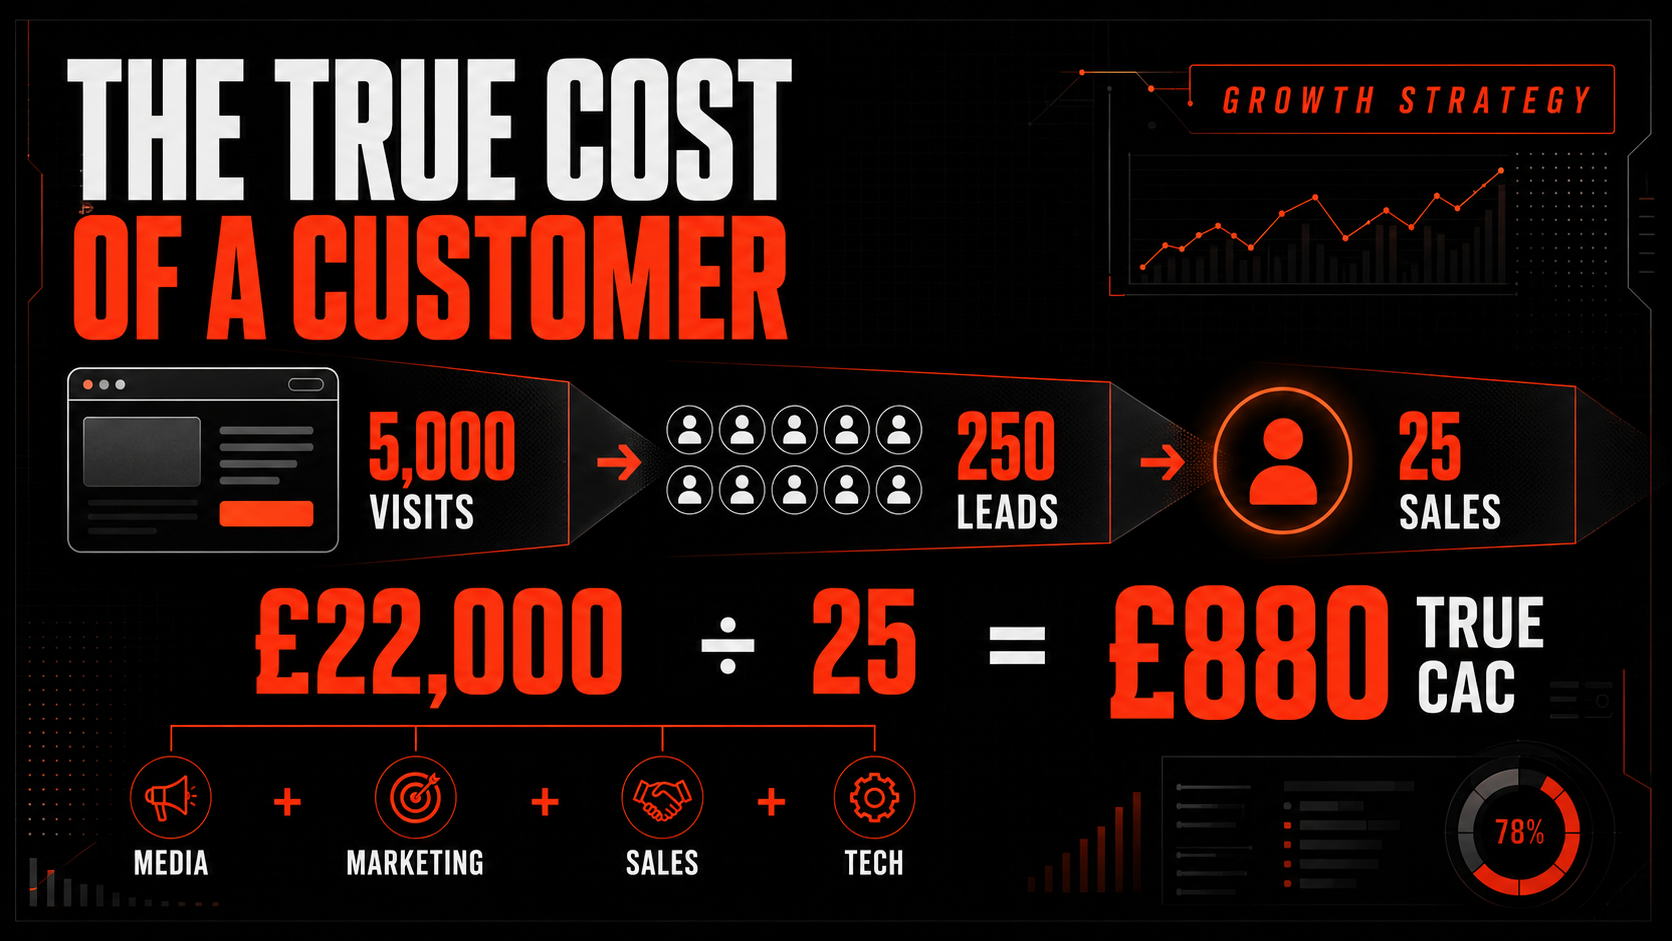
True customer acquisition cost is the complete marketing and sales cost required to turn prospective website visitors into genuinely new paying customers. It is not simply advertising spend divided by platform-reported conversions. It should include the traffic, people, technology, agency, creative, qualification and sales activity required to win the customer.
The primary calculation is:
True CAC = Total relevant marketing and sales acquisition costs ÷ New customers acquired
To understand why that CAC is rising or falling, map the complete journey:
Website visits → Valid leads → Qualified leads → Opportunities → New customers → Revenue → Contribution profit
This produces two distinct but connected management views:
- True CAC reveals what the business actually spent to acquire each new customer.
- Funnel conversion rates reveal where the acquisition cost was created.
If the company knows only its cost per lead or the CPA displayed by an advertising platform, it cannot reliably judge whether customer acquisition is commercially sustainable.
The true customer acquisition cost formula
A practical fully loaded formula is:
True CAC = (Paid media + Marketing people and production + Agencies + Acquisition technology + Sales acquisition costs + Allocated acquisition overhead) ÷ New customers
The denominator matters as much as the numerator. Count genuinely new customers acquired during or from the measured cohort. Do not mix new customers with renewals, repeat orders, customer-service enquiries or deals that were already effectively won before the measured activity.
For example, suppose a company incurs the following monthly acquisition costs:
| Cost category | Monthly amount |
|---|---|
| Paid media | £10,000 |
| Marketing team and creative allocation | £3,000 |
| Agency support | £2,000 |
| Sales salaries and commission allocation | £5,000 |
| CRM, call tracking and automation | £1,000 |
| Allocated acquisition operations | £1,000 |
| Total acquisition cost | £22,000 |
If that activity creates 25 new customers:
True CAC = £22,000 ÷ 25 = £880
The media-only CAC would be £400:
£10,000 ÷ 25 = £400
The £400 figure remains useful for media management. However, presenting it as the cost of acquiring a customer would ignore £480 per customer of real acquisition expenditure.
Map the complete visit-to-sale funnel
True CAC is the final outcome. The following rates diagnose it.
Visit-to-lead conversion rate
Visit-to-lead rate = Valid leads ÷ Relevant website visits × 100
Use relevant landing-page sessions or users consistently. Exclude obvious internal traffic and irrelevant pages where appropriate. If the business switches between users, sessions and page views, trend comparisons become unreliable.
Cost per website visit
Cost per visit = Traffic acquisition cost ÷ Relevant website visits
For paid campaigns this can be calculated directly. For SEO, content, email or outbound activity, allocate the relevant production, management and technology cost rather than labelling the visits free.
Cost per valid lead
Cost per valid lead = Lead-generation cost ÷ Valid leads
Remove duplicates, spam, test submissions, job enquiries and contacts outside the service criteria. Keep the rules stable so improving data hygiene does not look like a sudden decline in performance.
Qualified-lead rate
Qualified-lead rate = Qualified leads ÷ Valid leads × 100
Marketing and sales need one agreed definition. Qualification may include need, location, budget, authority, timeframe, customer type and minimum commercial value.
Lead-to-sale conversion rate
Lead-to-sale rate = New customers ÷ Valid leads × 100
Also measure qualified-lead-to-opportunity and opportunity-to-sale conversion. The overall rate identifies the size of the problem; stage-level conversion identifies its location.
Visit-to-sale conversion rate
Visit-to-sale rate = New customers ÷ Relevant visits × 100
It can also be modelled as:
Visit-to-sale rate = Visit-to-lead rate × Lead-to-sale rate
If 5% of visitors become valid leads and 10% of those leads become customers:
5% × 10% = 0.5% visit-to-sale conversion
The business requires approximately 200 relevant website visits to create one customer.
How funnel conversion creates acquisition cost
The component rates can be combined into a diagnostic media-CAC formula:
Media CAC = Cost per visit ÷ (Visit-to-lead rate × Lead-to-sale rate)
Suppose:
- Cost per visit: £4.
- Visit-to-lead conversion: 5%.
- Lead-to-sale conversion: 10%.
Visit-to-sale conversion is 0.5%, so:
£4 ÷ 0.5% = £800 media CAC
This can also be calculated from CPL:
CPL = £4 ÷ 5% = £80
Media CAC = £80 ÷ 10% = £800
This relationship makes the commercial levers visible:
- Lower traffic cost can reduce CAC if traffic quality holds.
- Better visit-to-lead conversion can reduce CAC if downstream quality holds.
- Better lead-to-sale conversion can reduce CAC without buying additional traffic.
- Greater customer value does not reduce CAC, but it can make a higher CAC commercially viable.
A worked visit-to-lead-to-sale example
A business generates 5,000 relevant website visits in one month.
| Funnel stage | Volume | Stage conversion |
| Relevant website visits | 5,000 | — |
| Valid leads | 250 | 5% of visits |
| Qualified leads | 125 | 50% of valid leads |
| Opportunities | 75 | 60% of qualified leads |
| New customers | 25 | 33.3% of opportunities |
Overall lead-to-sale conversion is:
25 ÷ 250 = 10%
Overall visit-to-sale conversion is:
25 ÷ 5,000 = 0.5%
Using the £22,000 total acquisition cost from the earlier example:
- Fully loaded cost per visit: £22,000 ÷ 5,000 = £4.40.
- Fully loaded cost per valid lead: £22,000 ÷ 250 = £88.
- Fully loaded cost per qualified lead: £22,000 ÷ 125 = £176.
- True CAC: £22,000 ÷ 25 = £880.
These stage costs are not separate amounts to add together. They are different views of the same acquisition expenditure as the prospect pool narrows.
Which costs belong in true CAC?
The test is whether the cost supports winning new customers and would materially reduce if the company stopped acquiring them. The allocation should be consistent, documented and useful for decisions.
Paid media and channel costs
Include applicable spend from:
- Google, Microsoft, Meta and LinkedIn Ads.
- Paid directories and lead platforms.
- Affiliates and commercial partnerships.
- Sponsorships and events.
- Influencer or creator acquisition activity.
- Direct-mail and outbound acquisition.
Separate brand defence, remarketing and existing-customer activity where these have different incrementality or customer objectives.
Marketing people and production
Include the proportion used for acquisition:
- Marketing salaries and employment costs.
- Content, SEO and digital PR.
- Design, video and advertising creative.
- Landing-page strategy, build and testing.
- Campaign management and optimisation.
- Freelancers and specialist consultants.
SEO and content clicks have no media charge, but the work required to earn and maintain them has a cost. For management purposes, allocate that investment over a reasonable period rather than calling organic acquisition free.
Sales acquisition costs
Include:
- Sales salaries, employment costs and commissions.
- Sales-management allocation.
- Lead qualification and appointment setting.
- Telephone calls, discovery meetings and demonstrations.
- Proposal and quotation production.
- Samples, trials and pre-sale technical support.
- Travel directly connected to winning new business.
Where onboarding is necessary to deliver the contracted service after the sale, it normally belongs in customer delivery cost rather than acquisition. Where a free setup or proof-of-concept is required to win the deal, it may reasonably belong in CAC. Define the boundary once and apply it consistently.
Acquisition technology
Include the relevant share of:
- CRM and sales-enablement systems.
- Call tracking and recording.
- Marketing automation and email tools.
- Data enrichment and lead-routing software.
- Analytics, attribution and reporting.
- Landing-page and testing platforms.
Do not allocate the entire enterprise software bill if most usage serves existing customers or unrelated operations.
Agencies and external partners
Include acquisition-related retainers and fees for media, SEO, creative, strategy, automation or lead qualification. Keep media spend and management fees separate in the diagnostic view, even though both belong in fully loaded CAC.
Allocated overhead
Include a fair share of marketing operations, acquisition-focused training, compliance, data support and management time. Avoid turning CAC into a full-company cost-allocation exercise. Rent, general finance and unrelated executive overhead are better assessed through company contribution and profitability unless they vary directly with acquisition.
Costs that should not be mixed in blindly
True CAC becomes less useful when every business expense is allocated into it.
Normally separate:
- The cost of serving customers after acquisition.
- Product cost and fulfilment.
- General corporate overhead.
- Retention campaigns aimed at existing customers.
- Account management and customer success after the initial sale.
- Research or brand investment with no defensible acquisition allocation.
These costs still matter. Product and service delivery belong in contribution margin; retention belongs in customer lifetime economics; general overhead is funded from the contribution remaining after acquisition.
The aim is not to exclude inconvenient costs. It is to place each cost in the part of the commercial model where it supports a decision.
Use new customers in the denominator
An acquisition programme should not look efficient because existing customers purchased again.
Separate:
- New customers.
- Returning customers.
- Renewals and expansions.
- Reactivated customers.
- Existing-customer enquiries.
If £30,000 of acquisition cost is divided by 60 reported sales, CAC appears to be £500. If only 30 of those sales came from genuinely new customers, new-customer CAC is £1,000.
This distinction is particularly important in platform reporting, branded search and remarketing, where existing demand can receive advertising credit.
Compare true CAC with customer contribution
Revenue does not determine whether CAC is affordable. Contribution does.
For an e-commerce or product business:
Customer contribution before acquisition = Revenue − Product cost − Fulfilment − Payment fees − Discounts − Expected returns
For a service or lead-generation business:
Customer contribution before acquisition = Revenue − Direct delivery labour − Contractors − Commission − Onboarding − Variable servicing costs − Bad-debt allowance
Then:
Contribution after acquisition = Customer contribution before acquisition − True CAC
If an average customer creates £2,000 of revenue but only £1,200 of contribution before acquisition, a true CAC of £880 leaves:
£1,200 − £880 = £320 contribution after acquisition
The business must decide whether £320 adequately funds fixed overhead, risk and required profit.
Calculate CAC payback
A customer may be profitable over their lifetime but still create a cash-flow problem.
CAC payback period = True CAC ÷ Average monthly customer contribution after delivery costs
If true CAC is £1,200 and a retained customer produces £300 monthly contribution before acquisition recovery:
£1,200 ÷ £300 = 4 months
For irregular revenue, use a cohort cash-flow schedule instead of a simple monthly average. Include churn, cancellation and delayed payment.
Management should normally set both:
- A maximum allowable CAC.
- A maximum acceptable payback period.
An acquisition plan can meet a lifetime-value ratio but still consume cash faster than the company can fund it.
Avoid CAC-to-LTV shortcuts
Lifetime value is useful when based on mature, comparable cohorts. It becomes dangerous when lifetime revenue is mistaken for profit or when future retention is assumed without evidence.
Use:
Contribution-based LTV = Expected lifetime revenue − Expected lifetime variable delivery and servicing costs
Adjust for:
- Churn and renewal probability.
- Customer cohort and acquisition source.
- Refunds, cancellations and bad debt.
- Discounts and price changes.
- The delay before cash is received.
- Uncertainty in immature customer data.
First-order or first-year contribution is often a safer basis for short-term acquisition decisions. Lifetime contribution can support a higher CAC only when the business has reliable evidence and enough cash to tolerate the payback.
Why blended CAC can hide losses
An account-wide number can conceal large differences.
Analyse true CAC by:
- Channel and campaign.
- Brand and non-brand demand.
- Product or service line.
- Customer type and value band.
- Geography.
- Landing page and offer.
- Sales team or representative.
- One-off and recurring customers.
- New and reactivated customers.
- First-order contribution and lifetime contribution.
For example:
| Segment | True CAC | Customer contribution before acquisition | Contribution after acquisition |
| Small one-off service | £650 | £700 | £50 |
| Mid-market retainer | £1,200 | £3,000 | £1,800 |
| Enterprise project | £4,500 | £12,000 | £7,500 |
The blended CAC may appear healthy, but the small-service segment barely contributes. The appropriate response might be higher pricing, stronger qualification, a lower-cost sales route or reduced acquisition—not an account-wide budget cut.
Find the stage increasing CAC
Use a funnel waterfall rather than blaming the channel with the largest spend.
| Performance pattern | What to investigate |
| Cost per relevant visit rises | Auction pressure, targeting, creative, media mix and competition |
| Visit-to-lead conversion falls | Message match, landing page, offer, form, mobile speed and trust |
| Valid-lead rate falls | Spam, broad targeting, incentives and qualification criteria |
| Qualified-lead rate falls | Commercial intent, audience, keywords, proposition and service fit |
| Contact rate falls | Data quality, routing, response time and sales capacity |
| Opportunity rate falls | Discovery, qualification, price and customer need |
| Win rate falls | Proposal, competition, proof, negotiation and follow-up |
| Customer value falls | Product mix, discounting, scope and customer type |
| Contribution falls | Delivery cost, returns, commission and fulfilment |
Different constraints require different action. Lower bids will not repair a broken form; more traffic will not solve slow lead response; cheaper leads will not rescue an uncompetitive proposition.
How conversion improvements compound
Return to the £22,000 monthly cost and 5,000 visits.
Baseline:
- Visit-to-lead rate: 5%.
- Valid leads: 250.
- Lead-to-sale rate: 10%.
- Customers: 25.
- True CAC: £880.
If visit-to-lead conversion rises to 6%, with quality unchanged:
- Valid leads: 300.
- Customers at 10%: 30.
- True CAC: £22,000 ÷ 30 = £733.33.
If lead-to-sale conversion also rises to 12%:
- Customers: 300 × 12% = 36.
- True CAC: £22,000 ÷ 36 = £611.11.
Improving the two stages reduces true CAC by approximately 31% without increasing acquisition cost.
This is why growth strategy should not default to buying more traffic. Conversion, qualification, sales operations and customer value can produce a larger commercial return.
Measure by acquisition cohort
A lead created in January may not become a customer until March. Dividing January costs by January sales mixes different groups and can distort CAC.
Build cohorts by the lead or customer acquisition date and track them until the normal sales cycle has matured:
- Acquisition cost attached to the cohort.
- Visits, leads and qualified leads.
- Customers after 30, 60, 90 and 180 days.
- Revenue and contribution realised.
- Sales-cycle length.
- Payback and retention.
For long sales cycles, show both:
- Realised CAC: Cost divided by customers already closed.
- Forecast mature CAC: Cost divided by customers expected when the cohort matures.
Keep the forecast clearly labelled and replace it with realised results over time.
Connect analytics, CRM and finance
Website analytics cannot calculate true CAC alone because the sale may close offline and the full costs live elsewhere.
A practical measurement architecture connects:
- Analytics: Visit, source, campaign, landing page and lead event.
- CRM: Lead identifier, qualification, owner, opportunity, sales outcome and dates.
- Advertising platforms: Spend, clicks and campaign attribution.
- Finance or commerce: Actual revenue, refunds, commission and contribution costs.
- Workforce and suppliers: Marketing and sales resource allocation.
Google Analytics recommends lead-generation events including generate_lead, qualify_lead, working_lead and close_convert_lead. Its Lead acquisition report can use these events to show new, qualified and converted leads. Google Analytics lead-generation events and Lead acquisition report
Google Ads also supports qualified-lead and converted-lead goals for measuring deeper funnel stages. Enhanced conversions for leads can connect permitted first-party lead data and imported CRM outcomes with earlier ad interactions. Google Ads qualified and converted leads and Enhanced conversions for leads
These tools improve the connection between marketing and offline outcomes, but they do not allocate payroll, agency or operational costs automatically. The fully loaded CAC calculation still requires a commercial data model.
A monthly true-CAC scorecard
Report the funnel and economics together:
| Layer | Metrics |
| Traffic | Relevant visits, cost per visit, channel and landing page |
| Lead generation | Valid leads, visit-to-lead rate, cost per valid lead |
| Qualification | Qualified leads, qualification rate, cost per qualified lead |
| Sales | Response time, contact rate, opportunities, win rate and sales cycle |
| Customer acquisition | New customers, media CAC and fully loaded true CAC |
| Commercial return | Revenue, contribution, contribution after CAC and payback |
| Customer quality | Retention, repeat purchase, cancellation and lifetime contribution |
Show actual versus target, previous period and a comparable mature cohort. Separate leading indicators from final commercial outcomes.
A practical implementation plan
Step 1: agree the definitions
Define relevant visit, valid lead, qualified lead, opportunity, new customer, acquisition cost and customer contribution. Document exclusions.
Step 2: inventory acquisition costs
List media, people, agencies, production, technology and sales costs. Decide which are direct, allocated or excluded, and record the allocation method.
Step 3: connect the identifiers
Preserve source and campaign data from website entry through the CRM and sale. Deduplicate contacts and distinguish new customers from existing ones.
Step 4: establish the baseline
Calculate at least several months of funnel conversion, true CAC, customer contribution and payback. Use longer periods for low-volume or long-cycle businesses.
Step 5: segment the economics
Break performance down where customer value, margin, close rate or sales effort differs materially.
Step 6: identify the limiting stage
Estimate the financial effect of improving cost per visit, landing-page conversion, qualification, response, win rate or customer value.
Step 7: test one constraint at a time
Make controlled changes with a defined success measure. Judge the effect on mature customer acquisition and contribution, not merely clicks or forms.
The practical answer
Calculate true customer acquisition cost by adding the relevant marketing, sales, technology, agency and acquisition overhead required to win new customers, then dividing that amount by the number of genuinely new customers acquired:
True CAC = All relevant marketing and sales acquisition costs ÷ New customers
Use the visit-to-lead and lead-to-sale funnel to explain that result:
Visit-to-sale rate = Visit-to-lead rate × Lead-to-sale rate
Then compare true CAC with contribution before acquisition and the required payback period.
A low platform CPA can coexist with an unprofitable true CAC. A high CPL can be commercially attractive when leads convert well and create valuable customers. The correct objective is not the cheapest visit, lead or sale in isolation. It is a predictable acquisition system that converts investment into sufficient customer contribution within a timeframe the business can fund.
Book a Strategy Call
If your reporting stops at website conversions, platform CPA or cost per lead, Clubbish can map the full acquisition journey from channel and website visit through CRM, sales conversion, customer value and contribution profit. We will establish your true CAC, identify the most expensive funnel constraint and prioritise the changes most likely to create profitable growth.