
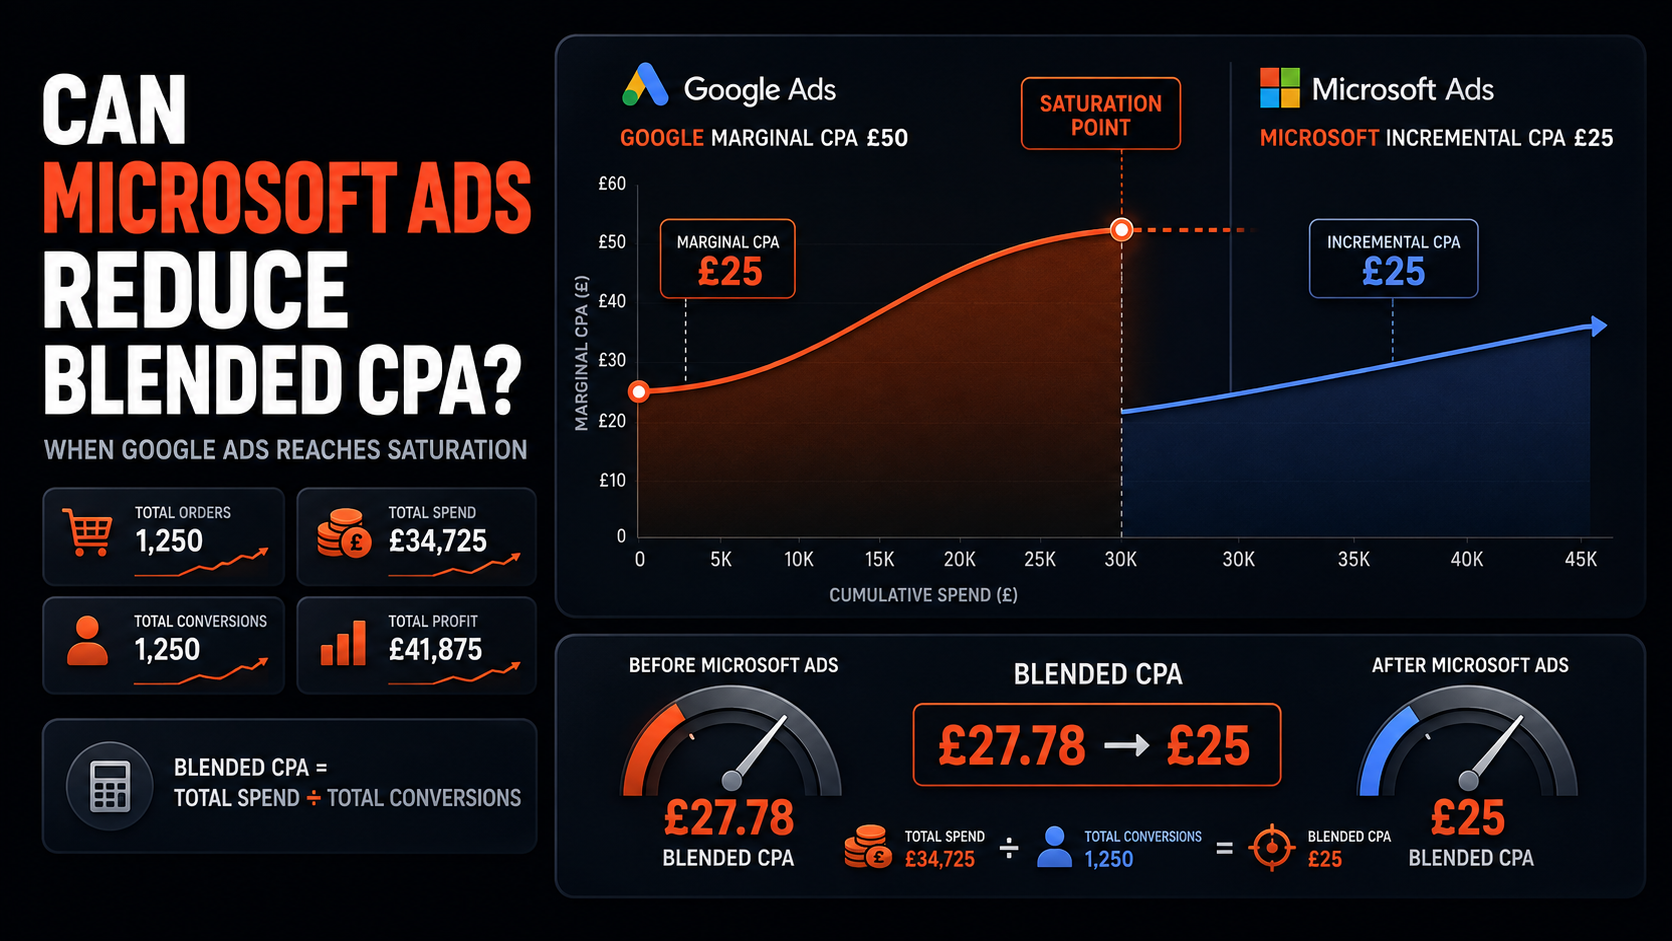
Yes—Microsoft Ads can reduce your blended CPA when Google Ads has reached saturation, but only when Microsoft produces genuinely incremental conversions at a lower CPA than the marginal cost of gaining more conversions from Google.
It is an expansion opportunity, not an automatic fix. Microsoft has less scale, and cheaper clicks do not necessarily produce cheaper customers. The business must establish that Google is genuinely approaching diminishing returns, test Microsoft against the same commercial criteria and measure whether total orders and contribution profit increase.
The key comparison is not Microsoft’s average CPA versus Google’s average CPA. It is:
Microsoft’s incremental CPA versus Google’s marginal CPA on the next pound of spend.
The short answer
Microsoft can lower blended CPA when all of the following are true:
- Google’s most profitable demand is already being captured.
- Additional Google budget is producing fewer extra conversions.
- Microsoft reaches commercially valuable demand not already reached by Google.
- Microsoft’s additional conversions cost less than Google’s next conversions.
- Those conversions are genuinely incremental.
- The orders produce acceptable contribution profit after product costs, fulfilment and returns.
It will not help when Microsoft merely attracts cheap but low-converting clicks, receives credit for customers who would have purchased anyway, or brings low-margin and high-return orders.
What does Google Ads saturation mean?
Google Ads saturation does not mean the platform has stopped producing sales. It means the next increase in spend produces a weaker return than the spend already deployed.
This is a normal feature of auction-based advertising. The strongest queries, audiences, products and placements are generally captured first. As budgets rise, the campaign may enter more competitive auctions, broader searches, weaker product demand or less purchase-ready audiences.
Typical signs include:
- Spend rises faster than conversions.
- Conversion volume remains flat despite higher budgets.
- Marginal CPA increases while average CPA still looks acceptable.
- ROAS falls as targeting or inventory expands.
- High-intent campaigns already hold strong impression share.
- Profitable campaigns are no longer materially constrained by budget.
- Search-term expansion introduces weaker commercial intent.
- Google-attributed conversions grow without a proportional rise in store revenue or new customers.
- Contribution profit stops growing even though media spend continues to increase.
Google defines Search impression share as impressions received divided by the estimated impressions the advertiser was eligible to receive. It also reports Search lost impression share due to budget and rank. These measures help diagnose available auction headroom, although high impression share alone does not prove commercial saturation.
Average CPA can hide the problem
Average CPA is:
Average CPA = total spend ÷ total conversions
Marginal CPA is:
Marginal CPA = additional spend ÷ additional conversions
Suppose Google produces 800 orders from £20,000:
£20,000 ÷ 800 = £25 average CPA
The business then increases spend to £25,000 and receives 900 total orders. The additional £5,000 produced only 100 additional orders:
£5,000 ÷ 100 = £50 marginal CPA
The new account-wide average is:
£25,000 ÷ 900 = £27.78
The dashboard still displays a seemingly reasonable £27.78 average CPA, but the last block of budget acquired customers at £50 each. If the allowable CPA is £35, the account is already scaling beyond its profitable range.
This distinction is the foundation of the Microsoft decision.
How Microsoft can reduce blended CPA
Blended paid-search CPA is:
Blended CPA = (Google spend + Microsoft spend) ÷ (Google conversions + Microsoft conversions)
If Microsoft generates additional orders below Google’s marginal CPA, it can improve the combined result.
Scenario one: put the next £5,000 into Google
| Activity | Spend | Orders | CPA |
|---|---|---|---|
| Existing Google activity | £20,000 | 800 | £25 average |
| Additional Google spend | £5,000 | 100 | £50 marginal |
| Combined Google result | £25,000 | 900 | £27.78 blended |
Scenario two: put the next £5,000 into Microsoft
| Activity | Spend | Orders | CPA |
| Existing Google activity | £20,000 | 800 | £25 average |
| Microsoft test | £5,000 | 200 | £25 incremental |
| Combined paid-search result | £25,000 | 1,000 | £25 blended |
In the second scenario, Microsoft prevents blended CPA from rising and generates 100 more orders for the same total spend.
The result is valid only if the 200 Microsoft orders are incremental. If 80 would have occurred through Google, organic search, direct traffic or email anyway, the true incremental result is 120 orders:
£5,000 ÷ 120 = £41.67 incremental CPA
That may still outperform Google’s £50 marginal CPA, but it is very different from the reported £25.
Lower blended CPA is not automatically higher profit
CPA treats every conversion as equal. E-commerce orders rarely are.
Microsoft might generate a £25 CPA but deliver:
- Lower average order value.
- Lower-margin products.
- More discounts.
- Higher fulfilment costs.
- More cancellations or returns.
- A greater proportion of existing customers.
- Lower repeat-purchase value.
Compare contribution profit after advertising:
Contribution profit after ads = revenue − cost of goods − fulfilment − payment fees − expected returns − ad spend
For example:
| Metric | Additional Google | Microsoft |
| Spend | £5,000 | £5,000 |
| Orders | 100 | 200 |
| CPA | £50 | £25 |
| AOV | £150 | £70 |
| Revenue | £15,000 | £14,000 |
| Pre-ad contribution margin | 45% | 30% |
| Contribution before ads | £6,750 | £4,200 |
| Contribution after ads | £1,750 | -£800 |
Microsoft has the lower CPA but loses money because the orders have weaker economics. The business should never optimise blended CPA without checking contribution.
How to confirm Google is genuinely saturated
Do not declare saturation simply because one month’s CPA increased. Check for sustained evidence.
1. Analyse response to budget changes
Compare successive spend bands:
| Monthly Google spend | Conversions | Additional conversions | Marginal CPA |
| £20,000 | 800 | — | — |
| £25,000 | 900 | 100 | £50 |
| £30,000 | 970 | 70 | £71.43 |
| £35,000 | 1,015 | 45 | £111.11 |
This curve shows diminishing returns clearly. Each additional £5,000 buys fewer conversions.
Control for seasonality, promotions, stock, pricing, website changes and competitor activity. A demand decline can resemble saturation even when auction headroom remains.
2. Review impression share
High Search impression share on profitable campaigns may indicate that much of the eligible demand is already captured. Low lost impression share due to budget suggests more budget alone will not unlock substantial additional volume.
However, do not use impression share in isolation. An advertiser can have low impression share because many eligible searches are commercially unattractive. Chasing 100% may raise CPA without adding profit.
3. Inspect search-query expansion
If higher budgets cause spend to move from high-intent product and category searches into broader research queries, the campaign may be reaching the edge of profitable demand.
Look for:
- More clicks with no proportional order growth.
- Rising spend on generic or ambiguous terms.
- Falling conversion rate.
- Increasing dependence on branded conversion credit.
- Product groups consuming budget without contribution profit.
4. Compare platform growth with store growth
If Google Ads revenue rises by 20% while total store revenue increases only 2%, attribution may be moving rather than demand growing.
Review:
- Total orders and revenue.
- New customers.
- Direct and organic revenue.
- Branded search volume.
- Blended marketing efficiency.
- Contribution profit.
5. Check operational constraints
What looks like media saturation may be caused by:
- Out-of-stock bestsellers.
- Price increases.
- Weaker offers.
- Slower delivery.
- Mobile checkout problems.
- Landing-page changes.
- Poor product reviews.
- A less profitable catalogue mix.
Resolve those issues before moving budget between platforms.
Why Microsoft may provide a more efficient demand pool
Microsoft Search ads can appear on Bing and eligible search-partner sites. The network provides another set of auctions and searchers rather than simply duplicating Google inventory.
In July 2026, StatCounter estimated Bing’s share of UK desktop search at 10.77%. This does not predict Microsoft advertising performance, but it supports the possibility of a meaningful desktop opportunity for suitable retailers.
Microsoft is particularly worth testing when:
- Customers frequently buy on desktop.
- Products have clear category, model or compatibility searches.
- Average order value is high.
- Buyers undertake considered research.
- Google non-brand Search is mature.
- The catalogue contains strong-margin, in-stock products.
- Microsoft auctions appear less competitive for relevant terms.
Lower CPC can help, but the complete CPA relationship is:
CPA = CPC ÷ conversion rate
Google traffic at £1.50 CPC and 4% conversion produces a £37.50 CPA. Microsoft traffic at £0.90 CPC but 2% conversion produces a £45 CPA. The cheaper click creates the more expensive customer.
Build a fair Microsoft test
Start with proven commercial intent
Launch:
- Profitable non-brand Search terms.
- High-margin Shopping/Product Ads.
- In-stock bestsellers.
- Product categories with strong desktop conversion.
- Exact model, brand-plus-product and compatibility queries.
Microsoft supports Google Import, which can transfer eligible structures, keywords, ads, bids, budgets and other settings. Microsoft itself advises reviewing budgets, bids, targeting, URLs, conversion goals and tracking after import because settings may not transfer identically.
Keep traffic types visible
Separate Search from broader audience placements where possible. Search partners can extend reach, but their contribution should be reviewed independently rather than assumed to match Bing search traffic.
Implement Microsoft tracking correctly
Use Universal Event Tracking and appropriate conversion goals. Verify:
- Purchase fires once.
- Revenue and currency are correct.
- Transaction IDs prevent duplication.
- Refunds and cancellations are considered.
- New and returning customers can be distinguished.
- Microsoft totals reconcile with commerce data.
Use the same profit rules
Microsoft should not receive a more generous target merely because it is a new channel. Apply the same underlying margin, return and payback requirements used to assess Google.
Measure marginal performance, not platform averages
Use a spend-response table for both platforms:
| Spend band | Google marginal CPA | Microsoft marginal CPA | Best next allocation |
| First £5,000 | £22 | £28 | |
| £5,001–£10,000 | £27 | £30 | |
| £10,001–£15,000 | £34 | £31 | Microsoft |
| £15,001–£20,000 | £45 | £36 | Microsoft |
| £20,001–£25,000 | £58 | £49 | Depends on contribution and scale |
This demonstrates why neither channel should receive a fixed permanent allocation. Google may be more efficient at lower spend; Microsoft can become the better marginal option once Google’s strongest demand has been captured.
Test incrementality carefully
Attribution answers which ad interaction received credit. Incrementality asks whether the order happened because of advertising.
Microsoft’s reported CPA can be understated when campaigns capture:
- Existing brand searches.
- Returning customers.
- Remarketing audiences.
- Customers already influenced by email, social or Google.
- Purchases driven by a promotion that would have occurred anyway.
Use two views:
- Reported CPA: Microsoft spend divided by platform-attributed conversions.
- Incremental CPA: Microsoft spend divided by conversions estimated to have been caused by Microsoft.
Where volume allows, use matched geographic areas, customer holdouts or controlled time periods. Keep promotions, stock, pricing and other media activity as stable as possible.
At minimum, compare the Microsoft launch with changes in total-store orders, new customers, blended CPA and contribution profit.
A practical 90-day test plan
Before launch
- Establish Google’s spend-response curve.
- Calculate Google’s current marginal CPA.
- Confirm Search impression-share and budget-loss data.
- Reconcile purchase tracking.
- Calculate allowable CPA by margin band.
- Select suitable Microsoft queries and products.
- Record total-store and new-customer baselines.
Days 1–30: validate
- Confirm UET and purchase values.
- Check imported settings.
- Review search terms and partner traffic.
- Resolve feed and product-approval issues.
- Avoid declaring success from a small number of cheap conversions.
Days 31–60: compare
- Calculate Microsoft CPA by brand, non-brand and Shopping.
- Compare AOV, margin and return rate.
- Identify new-customer CPA.
- Compare Microsoft’s incremental result with Google’s marginal result.
- Review whether total-store orders are rising.
Days 61–90: allocate
- Hold Google near its efficient range.
- Move marginal budget towards the better incremental contribution return.
- Increase Microsoft gradually where demand remains.
- Reduce campaigns that rely on branded or existing-customer credit.
- Recalculate blended CPA after each material budget step.
When Microsoft will not reduce blended CPA
Microsoft is unlikely to help when:
- Google is not actually saturated.
- Profitable Google campaigns remain budget-limited.
- The customer base is overwhelmingly mobile-first.
- Microsoft conversion volume is too low for bidding and evaluation.
- Search terms are weak or irrelevant.
- The website converts Microsoft traffic poorly.
- Orders have low margin or high returns.
- Campaigns mainly capture existing demand.
- Tracking overstates Microsoft conversions.
- The platform is forced to spend beyond available qualified demand.
In these cases, the solution may be improving Google structure, conversion rate, product feeds, merchandising, offer quality or measurement—not adding another ad platform.
The decision rule
Microsoft is worth adding when:
Microsoft marginal contribution profit > Google marginal contribution profit
It is not worth adding merely because:
Microsoft reported CPA < Google average CPA
The first comparison concerns future profit. The second can be distorted by different audiences, attribution, brand demand and order economics.
The practical conclusion
So, can Microsoft Ads reduce your blended CPA when Google Ads has reached saturation? Yes—when Microsoft provides incremental orders below Google’s marginal CPA and those orders meet the business’s contribution-profit requirements.
The strongest model is often to hold Google around its efficient spending range rather than continually forcing it to scale, then use Microsoft to capture an additional pool of profitable Search and Shopping demand.
If Microsoft’s incremental CPA is lower than Google’s marginal CPA, blended CPA can fall while total conversions rise. If it is not, Microsoft simply becomes another source of spend.
The objective is not the lowest number displayed in either advertising dashboard. It is the highest sustainable incremental contribution profit across the combined paid-search portfolio.
Frequently asked questions
What is blended CPA?
Blended paid-search CPA is total Google and Microsoft spend divided by the total conversions attributed to or measured across those channels. For strategic decisions, use incremental conversions where possible.
How do you calculate marginal CPA?
Divide the additional spend by the additional conversions produced after the budget increase. Do not use the campaign’s historic average CPA as a substitute.
Does a high Google impression share prove saturation?
No. It indicates how much eligible impression opportunity is being captured. Saturation requires commercial evidence that additional spend is producing diminishing incremental conversions or profit.
Are Microsoft Ads clicks cheaper than Google Ads clicks?
They may be cheaper in some auctions, but this varies by category and query. Lower CPC only improves CPA when traffic quality and conversion rate remain strong.
Should Google spend be reduced to fund Microsoft?
Reduce only the Google spend whose marginal return is below the expected Microsoft opportunity. Do not cut profitable, budget-constrained Google campaigns simply to create platform diversity.
How long should the Microsoft test run?
A 60–90-day framework is useful for many established retailers, but the test needs enough conversions to compare marginal CPA, contribution and customer quality confidently.
What should be optimised if CPA and profit give different answers?
Prioritise incremental contribution profit. A lower CPA can still be commercially worse when orders have lower value, weaker margins or higher return rates.
Has Google reached its profitable limit?
Clubbish helps e-commerce teams identify paid-search saturation, compare marginal returns and determine whether Microsoft can add genuinely incremental growth.
If Google spend is rising faster than sales and you need an independent view of the next profitable move, book a marketing strategy consultation with Clubbish.