
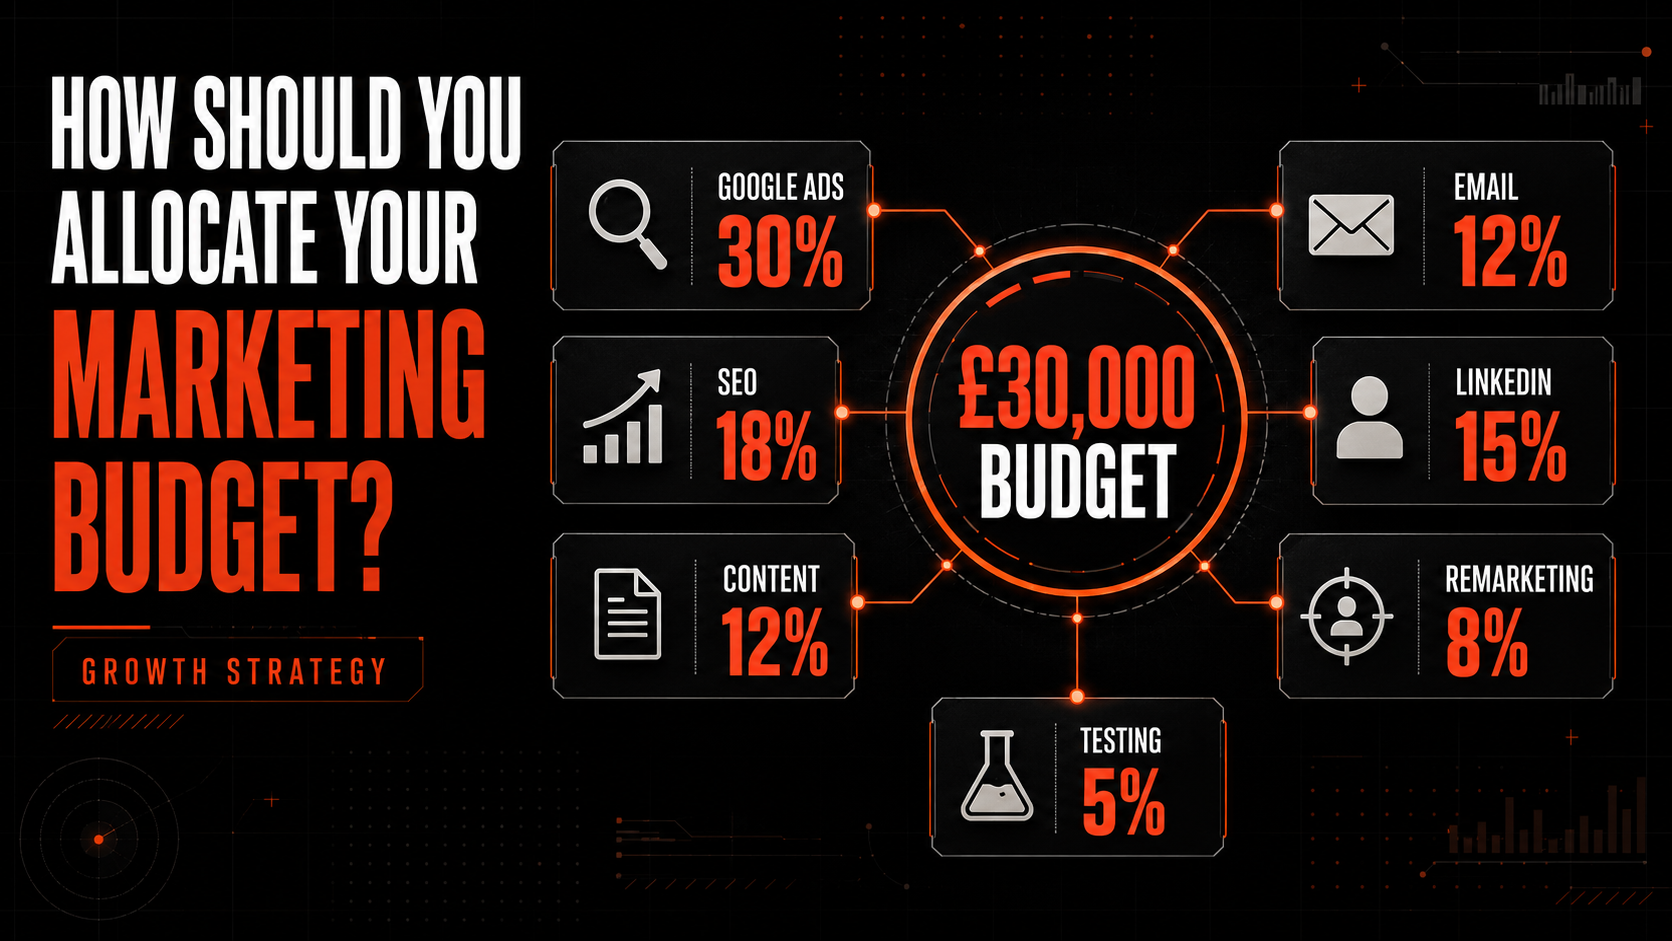
A lead-generation marketing budget should not be divided equally across Google Ads, SEO, content, email, LinkedIn and remarketing. Each channel performs a different commercial role, operates over a different timeframe and reaches a different level of buyer intent.
The right allocation funds the complete journey:
Demand creation → Demand capture → Lead generation → Nurture → Sales conversion → Customer value
For an established B2B or high-consideration lead-generation business with reliable tracking, a balanced starting hypothesis could be:
| Investment area | Starting allocation | Primary role |
|---|---|---|
| Google Ads | 30% | Capture active, high-intent demand |
| SEO | 18% | Build compounding organic demand capture |
| Content | 12% | Create demand, educate and improve conversion |
| Email and CRM | 12% | Nurture, reactivate and support opportunities |
| 15% | Reach decision-makers and target accounts | |
| Remarketing | 8% | Re-engage known visitors and prospects |
| Testing and measurement | 5% | Improve tracking and validate new opportunities |
| Total | 100% | — |
This is not a universal benchmark. It is a planning model to test against the company’s search demand, target market, sales cycle, margins, customer value, channel maturity and implementation capacity.
The final allocation should follow incremental contribution profit, not the cheapest CPL or the channel that claims the most conversions.
Start with the revenue and contribution target
Before allocating channels, define the outcome the budget must produce.
Suppose the plan requires:
- 30 new customers per month.
- £10,000 average first-year customer revenue.
- £4,000 customer contribution before acquisition.
- £1,500 maximum fully loaded CAC.
- 90-day maximum payback.
The maximum monthly acquisition cost at 30 customers is:
30 × £1,500 = £45,000
If £10,000 is needed for sales salaries, CRM and acquisition operations, the remaining £35,000 is available for media, SEO, content, email, LinkedIn, remarketing, agencies and measurement.
This approach works backwards from commercial reality. A percentage split without an allowable CAC or contribution target can distribute an unaffordable budget very neatly.
Set the lead-generation marketing budget by commercial role
The same channel can serve several stages. Google Ads may capture non-brand demand, defend branded search or remarket. Content may attract search traffic, power LinkedIn campaigns, nurture email leads and support sales proposals.
Assign investment to commercial roles:
| Funnel role | Typical channels | Core question |
| Demand creation | LinkedIn, research, content, video | Are more suitable buyers becoming aware of us? |
| Demand capture | Google Ads, SEO, commercial content | Are we visible when buyers actively investigate? |
| Lead conversion | Landing pages, forms, proof and offers | Does relevant traffic become valid enquiries? |
| Nurture | Email, content, webinars and sales enablement | Do known prospects progress toward a decision? |
| Re-engagement | Remarketing, email and branded search | Does further contact create additional conversion? |
| Measurement | Analytics, CRM and experimentation | Can we connect spend with customers and contribution? |
This prevents lower-funnel channels from receiving all the budget simply because they are closest to the sale.
Google Ads: capture demand that exists now
Google Ads should normally receive the largest paid allocation when prospects actively search for the service or problem, search volume is meaningful and customer contribution supports auction costs.
Increase Google’s share when:
- Profitable non-brand campaigns are constrained by budget.
- Search impression share can grow at an acceptable marginal CAC.
- Search terms show strong commercial intent.
- Landing pages and sales follow-up convert reliably.
- Higher-value services have untapped demand.
Reduce or hold its share when:
- Brand search and remarketing inflate reported efficiency.
- Additional budget expands into weaker queries.
- Lead quality falls as match types or automation broaden.
- Search demand is already substantially captured.
- Sales capacity cannot handle more enquiries.
Measure:
- Valid and qualified leads.
- Cost per qualified lead.
- Lead-to-sale rate.
- New-customer CAC.
- Revenue and contribution per lead.
- Marginal CAC as spend rises.
- Incremental customers and profit.
Import deeper CRM outcomes where possible. Google supports qualified-lead and converted-lead goals so campaigns can be evaluated beyond initial forms. Google Ads qualified and converted leads
Do not give Google unlimited budget because it produces leads quickly. Once the strongest demand is captured, the next pound may be more productive in SEO, LinkedIn, content or conversion improvement.
SEO: build compounding demand capture
SEO deserves sustained investment where relevant search demand recurs and the business can implement technical, content and authority improvements.
SEO costs include:
- Strategy and research.
- Technical audits and development.
- Commercial landing pages.
- Editorial content.
- Digital PR and authority building.
- Internal management and specialist tools.
Increase SEO’s share when:
- Paid search CPCs are rising.
- Valuable commercial pages lack organic visibility.
- Non-brand organic acquisition is underdeveloped.
- Content can support a long buying process.
- The website has technical or architectural constraints.
Reduce or delay additional investment when recommendations are not being implemented, relevant demand is too small, content quality cannot be maintained or the business requires immediate pipeline that SEO cannot produce within the available time.
Measure organic performance by lead and customer cohorts:
- Non-brand commercial visibility.
- Relevant organic landing-page visits.
- Valid and qualified leads.
- Lead-to-sale conversion.
- Revenue and contribution by landing page.
- Fully allocated SEO CAC over an appropriate period.
- Assisted pipeline and payback.
SEO is not free traffic. Its value is the possibility of durable, compounding acquisition—not the absence of a media invoice.
Content: fund an asset used across the funnel
Treat content as an asset portfolio, not a blog-post quota.
High-value formats include:
- Original research and industry reports.
- Pricing, cost and ROI guides.
- Comparisons and alternative pages.
- Case studies with commercial evidence.
- Service explainers and implementation guides.
- Calculators, audits and diagnostic tools.
- Webinar and event material.
- Objection-handling and sales-enablement content.
Content can support several budget lines at once. One research report may attract organic links, power a LinkedIn lead campaign, create an email sequence, support remarketing and give sales a reason to contact target accounts.
Measure its role:
- Qualified traffic created.
- Leads and accounts influenced.
- Qualification and close-rate differences.
- Sales-cycle length.
- Revenue and contribution from associated cohorts.
- Reuse across paid, email and sales.
A content asset generating few direct leads may still be valuable if it improves opportunity conversion or enables a successful LinkedIn campaign. But “assisted” value should not become an excuse for content with no measurable commercial use.
Email and CRM: convert demand already acquired
Email normally has low marginal distribution cost, but it still requires platform, data, strategy, creative, automation and compliance resource.
Prioritise:
- New-lead welcome and qualification journeys.
- Report or webinar follow-up.
- Segment-specific nurture.
- Open-opportunity support.
- Re-engagement of dormant suitable leads.
- Lost-opportunity recycling.
- Customer expansion and referral programmes.
Separate acquisition support from retention. Emailing existing customers may produce excellent revenue, but it should not be reported as new-customer acquisition.
Increase email and CRM investment when:
- A large database receives little structured nurture.
- Lead response or follow-up is inconsistent.
- The sales cycle is long.
- Strong content exists but is underused.
- Lost and dormant opportunities contain recoverable value.
Measure:
- Progression from lead to qualified and opportunity.
- Meetings and sales influenced.
- Incremental conversion per eligible recipient.
- Revenue and contribution from reactivated leads.
- Sales-cycle and close-rate changes.
- Unsubscribe, complaint and data-quality trends.
Open and click rates diagnose delivery and engagement; they are not commercial outcomes.
LinkedIn: reach the right professional audience
LinkedIn is particularly relevant when job title, seniority, company, sector, account list or buying-group membership matters.
LinkedIn’s advertising tools can target professional attributes such as job title, company, industry and seniority, while Matched Audiences can support website, contact and account targeting. LinkedIn lead-generation advertising
Increase LinkedIn’s share when:
- The addressable audience is well defined.
- Average contract value supports a higher CPL.
- Named accounts or sectors matter.
- Several decision-makers influence the sale.
- Research, webinars or cases provide a credible offer.
- The business needs to create demand, not only capture searches.
Reduce or restructure it when targeting is too broad, lead magnets attract junior or irrelevant contacts, sales cannot follow up appropriately or the audience is too small for the proposed spend.
LinkedIn Lead Gen Forms can use pre-filled profile information and connect with CRM or automation systems, but low-friction submission still requires downstream qualification. LinkedIn Lead Gen Forms
Measure:
- Cost per qualified account or decision-maker.
- Sales-accepted leads.
- Opportunity creation and pipeline value.
- Win rate and contract value.
- Account penetration.
- Contribution profit and payback.
A £250 LinkedIn lead can be better than a £50 search lead if it is a decision-maker at a high-value target account and converts accordingly.
Remarketing: support conversion without overclaiming it
Remarketing reaches people who have already visited, engaged or entered the database. Its audience is limited, so it rarely deserves the largest budget.
Use it to:
- Return high-intent service-page visitors.
- Promote proof and case studies.
- Address common objections.
- Support webinar or report follow-up.
- Stay visible during a long buying cycle.
- Exclude unsuitable or already converted contacts.
Segment by:
- Pages and services viewed.
- Recency and frequency.
- Lead and opportunity status.
- Target-account membership.
- Existing-customer status.
High reported conversion can reflect selection rather than causality: these people were already more likely to convert. Use holdouts or controlled audience exclusions where practical, and compare total conversion when activity is absent.
Cap spend based on available eligible reach. Forcing a larger budget into a small audience usually increases frequency before it creates more incremental customers.
Protect a testing and measurement reserve
Do not allocate 100% of the budget to current delivery. Reserve approximately 5–10% for:
- Analytics and CRM connection.
- Call tracking and lead deduplication.
- Enhanced conversion or offline outcome imports.
- Landing-page tests.
- New channel or audience pilots.
- Incrementality experiments.
- Creative and offer testing.
Without measurement, the other allocations are less reliable. Without testing, the channel mix becomes a historic habit.
Three practical budget models
The appropriate mix depends on business maturity and timing.
Immediate pipeline model
For a business needing near-term demand with established search volume:
| Area | Allocation |
| Google Ads | 45% |
| SEO | 12% |
| Content | 8% |
| Email and CRM | 10% |
| 12% | |
| Remarketing | 8% |
| Testing and measurement | 5% |
This increases demand capture but retains enough investment to avoid sacrificing the future completely.
Balanced growth model
For an established business seeking pipeline now and lower acquisition dependency later:
| Area | Allocation |
| Google Ads | 30% |
| SEO | 18% |
| Content | 12% |
| Email and CRM | 12% |
| 15% | |
| Remarketing | 8% |
| Testing and measurement | 5% |
Strategic account model
For high-value B2B services with a defined buying committee and smaller search demand:
| Area | Allocation |
| Google Ads | 18% |
| SEO | 15% |
| Content and research | 18% |
| Email and CRM | 14% |
| 25% | |
| Remarketing | 5% |
| Testing and measurement | 5% |
These are hypotheses. Replace them with first-party economics once sufficient data exists.
A worked £30,000 allocation
Using the balanced model:
| Area | Percentage | Monthly investment |
| Google Ads | 30% | £9,000 |
| SEO | 18% | £5,400 |
| Content | 12% | £3,600 |
| Email and CRM | 12% | £3,600 |
| 15% | £4,500 | |
| Remarketing | 8% | £2,400 |
| Testing and measurement | 5% | £1,500 |
| Total | 100% | £30,000 |
Now attach a channel forecast:
| Area | Expected commercial output | Decision threshold |
| Google Ads | Qualified leads and customers | Marginal CAC stays below allowable CAC |
| SEO | Commercial visibility and maturing leads | Cohort contribution supports the investment horizon |
| Content | Assets used by acquisition and sales | Measurable pipeline, conversion or acquisition support |
| Email and CRM | Lead progression and reactivation | Incremental opportunities exceed programme cost |
| Qualified target accounts and pipeline | Expected contribution justifies higher CPL and cycle | |
| Remarketing | Additional conversion among known audiences | Lift exceeds what would happen without ads |
| Testing | Improved measurement or validated growth lever | Decision value justifies test cost |
The budget table alone is not a strategy. The forecast and thresholds make it one.
Forecast each channel through to contribution
For traffic-led channels:
Expected customers = Relevant visits × Visit-to-lead rate × Lead-to-sale rate
Expected contribution after acquisition = Expected customers × Contribution per customer − Channel cost
For account-based LinkedIn or outbound programmes, replace traffic with target accounts reached and use account-to-opportunity and opportunity-to-sale conversion.
For email nurture, use eligible leads, progression lift and eventual customer contribution rather than treating every email click as a new lead.
Include sales-cycle timing. Google may create opportunities that close this month, while SEO and LinkedIn investment may produce pipeline several months later. Compare mature cohorts, not only same-month revenue.
Avoid cross-channel double counting
A prospect may:
- Read an organic article.
- Download a report from LinkedIn.
- Receive an email sequence.
- Return through Google Ads.
- See remarketing.
- Speak to sales and purchase.
Do not add the revenue claimed by each platform.
Use:
- One CRM lead and account record.
- Stable source and campaign fields.
- Consistent UTM conventions.
- First-touch, lead-creation and opportunity-source views.
- New-customer reporting.
- Total customer and contribution reconciliation.
- Incrementality tests for material uncertain spend.
Google Analytics’ attribution-paths report can help show channels that initiate, assist and close key events, along with time and touchpoints. Google Analytics attribution paths
Use path reporting to understand journeys, not to multiply the same sale across budgets.
Reallocate by marginal contribution
Historic average channel performance should not determine every future pound.
Marginal CAC = Additional channel cost ÷ Additional new customers
Marginal contribution profit = Additional customer contribution − Additional channel cost
Example:
- Google’s current £9,000 produces 15 incremental customers: £600 CAC.
- A further £3,000 is expected to produce three more: £1,000 marginal CAC.
- A £3,000 LinkedIn test is expected to create four customers worth greater contribution: £750 expected CAC.
If customer quality and timing support the forecast, LinkedIn is the stronger destination for the next £3,000 even though Google’s historic average remains lower.
Review:
- Available profitable demand.
- Lead and customer quality.
- Marginal rather than average CAC.
- Contribution per customer.
- Payback period.
- Sales and delivery capacity.
- Confidence in attribution and incrementality.
When to change the allocation
Increase a channel when:
- Mature cohorts meet contribution and payback targets.
- Additional demand exists.
- Sales can handle more volume.
- Implementation and creative capacity are available.
- The next increment remains commercially attractive.
Hold or reduce when:
- Lead volume rises but qualified opportunities do not.
- Attributed conversions rise without total customers or profit.
- Marginal CAC exceeds the allowable limit.
- Sales response or capacity deteriorates.
- Audience saturation or frequency weakens performance.
- The channel cannot be implemented properly.
Protect strategic investment from short-term overreaction. SEO, content and nurture should have defined milestones and investment horizons rather than being cut because they did not close customers in the same month.
A 90-day allocation process
Days 1–30: establish commercial truth
- Define valid lead, qualified lead, opportunity and new customer.
- Calculate allowable CAC and contribution by service.
- Reconcile channel, CRM and sales data.
- Separate acquisition, retention and remarketing.
- Document current spend, people and technology costs.
Days 31–60: build and launch the portfolio
- Fund proven demand capture.
- Create the priority SEO and content assets.
- Build nurture and reactivation sequences.
- Launch a controlled LinkedIn audience and offer test.
- Segment remarketing and cap frequency.
- Reserve a clear measurement and experiment budget.
Days 61–90: evaluate leading evidence
- Compare valid and qualified lead rates.
- Review opportunity creation and pipeline value.
- Measure response time and sales handling.
- Identify early marginal-cost changes.
- Reallocate obvious waste while allowing long-cycle cohorts to mature.
At 180 days, compare mature customer contribution, CAC and payback by channel and revise the strategic mix.
The practical answer
For an established lead-generation business, a balanced starting allocation can be approximately:
- 30% Google Ads.
- 18% SEO.
- 12% content.
- 12% email and CRM.
- 15% LinkedIn.
- 8% remarketing.
- 5% testing and measurement.
Use a more Google-heavy mix when immediate high-intent pipeline is the priority and profitable search headroom exists. Use a more LinkedIn- and content-heavy mix when reaching named professional audiences and buying committees matters. Increase SEO where recurring non-brand demand can compound, and invest in email where valuable leads are being poorly nurtured.
Then replace the starting percentages with first-party evidence. Allocate the next pound to the activity expected to create the greatest incremental contribution profit within the company’s payback, sales-capacity and risk limits.
The goal is not to make every channel report the same CPL. It is to create a connected portfolio in which demand creation, capture, nurture and conversion collectively produce predictable profitable customers.
Book a Strategy Call
If your channel budgets have grown historically rather than from a commercial model, Clubbish can connect Google Ads, SEO, content, email, LinkedIn and remarketing with your CRM, sales conversion and customer economics. We will build a defensible allocation, identify where the next pound is most valuable and create a measurement plan for profitable growth.