
Your target cost per lead should be the amount you can afford to pay for an enquiry after accounting for its probability of becoming a customer and the contribution value that customer creates. It should not be copied from an industry benchmark, inherited from last year’s advertising plan or set simply because an advertising platform recommends it.
The core calculation is:
Target CPL = Allowable customer acquisition cost × Lead-to-sale conversion rate
If the business can afford to spend £1,000 to acquire a customer and 10% of valid leads become customers, its target CPL is:
£1,000 × 10% = £100
That £100 is only defensible if the underlying customer value, margin and conversion rate are accurate. If lead-to-sale conversion falls to 5%, the target CPL falls to £50. If customer value rises and the business can afford a £1,500 acquisition cost, the same 10% close rate supports a £150 CPL.
This is why asking “What is a good CPL?” is usually the wrong starting point. The better question is:
What can we pay for a lead and still acquire customers at a cost, margin and payback period the business can sustain?
The target cost per lead formula
There are two steps.
First, calculate allowable customer acquisition cost:
Allowable CAC = Customer contribution value before acquisition − Required contribution after acquisition
Then convert that customer-level allowance into a lead-level target:
Target CPL = Allowable CAC × Lead-to-sale conversion rate
Suppose an average new customer generates £2,500 of contribution before marketing and sales acquisition costs. The business requires £1,300 to remain after acquisition to cover fixed overheads, risk and profit.
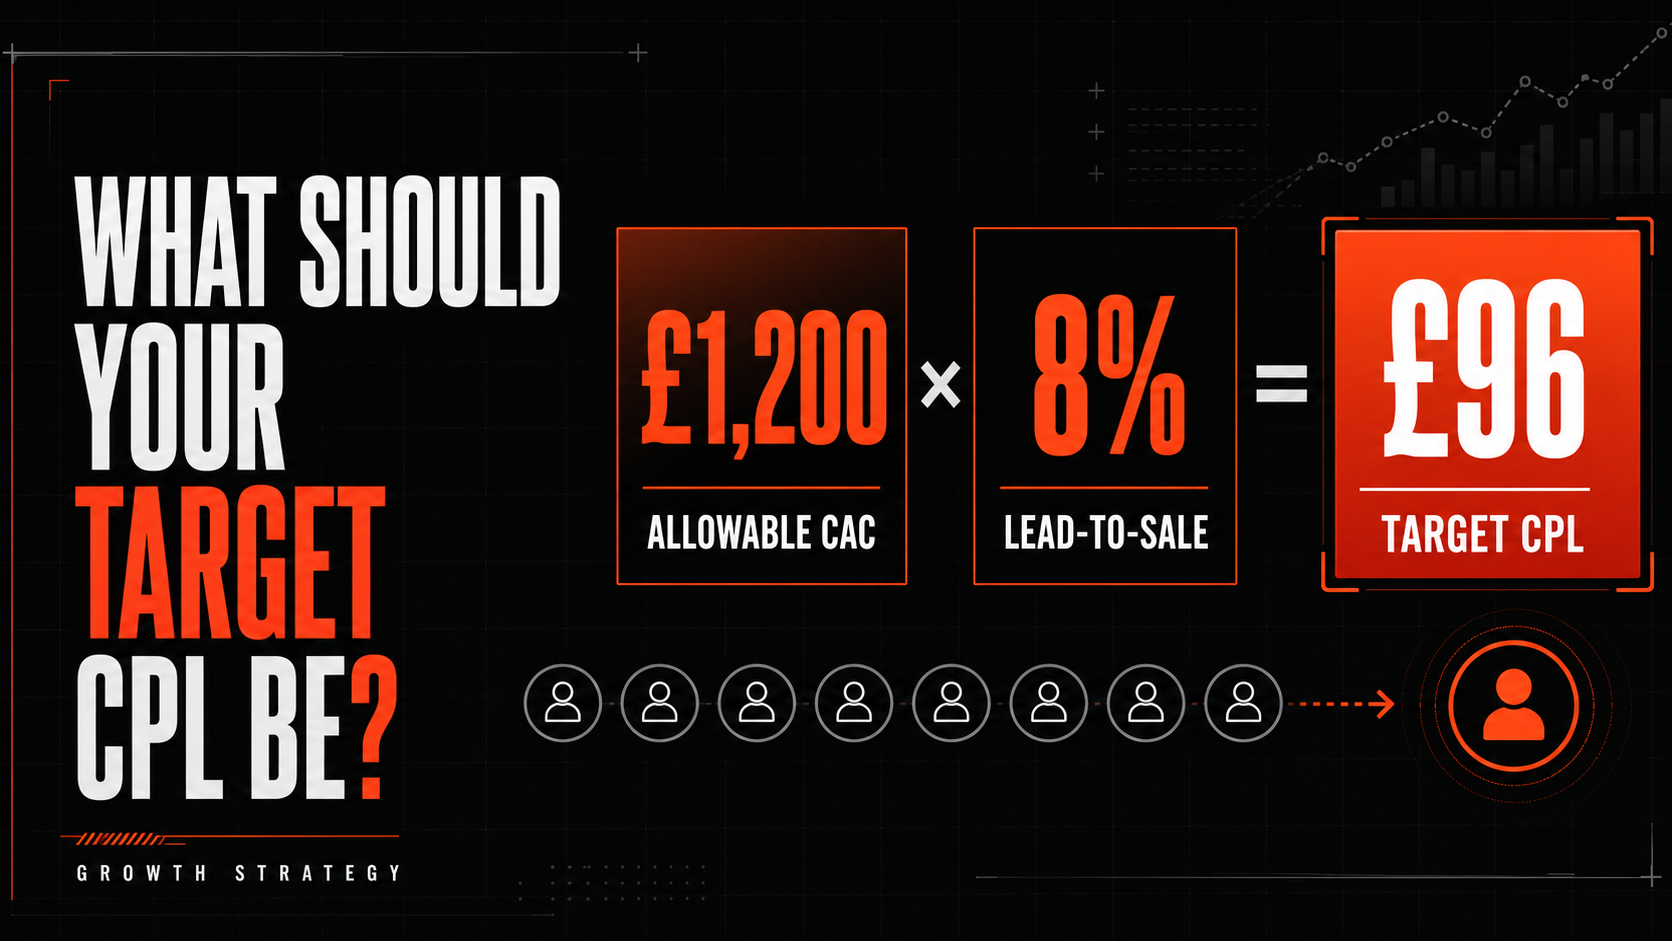
Allowable CAC = £2,500 − £1,300 = £1,200
If 8% of valid leads become customers:
Target CPL = £1,200 × 8% = £96
The company can spend up to £96 per valid lead while retaining the required customer contribution—provided sales performance and customer economics remain stable.
Why average customer value must mean contribution, not revenue
Average revenue per customer is not the same as the amount available to fund acquisition.
A £10,000 customer may require £6,000 of labour, materials, fulfilment, commission and other variable delivery costs. That customer contributes £4,000 before acquisition, not £10,000.
Calculate customer contribution value using the costs relevant to the business:
Customer contribution before acquisition = Customer revenue − Variable delivery and servicing costs
These costs may include:
- Product or service delivery.
- Direct labour and contractors.
- Materials and fulfilment.
- Payment fees.
- Sales commission.
- Discounts and incentives.
- Refunds, cancellations and bad debt.
- Onboarding and customer support.
- Other variable costs that increase with each customer.
Do not subtract the lead-generation spend at this stage; that is the acquisition cost the calculation is designed to determine.
For example:
| Customer economics | Amount |
|---|---|
| Average first-year revenue | £8,000 |
| Direct delivery cost | -£3,200 |
| Sales commission | -£400 |
| Onboarding and support | -£600 |
| Refund and bad-debt allowance | -£200 |
| Contribution before acquisition | £3,600 |
| Required contribution after acquisition | -£2,100 |
| Allowable CAC | £1,500 |
At an 8% lead-to-sale rate, the target CPL is:
£1,500 × 8% = £120
Using revenue instead would imply that far more value was available and could encourage the business to pay an unprofitable price for enquiries.
Break-even CPL and target CPL are not the same
The break-even CPL spends all customer contribution on acquisition:
Break-even CPL = Customer contribution before acquisition × Lead-to-sale conversion rate
If customer contribution is £3,600 and 8% of leads convert, break-even CPL is £288.
At £288 per lead, the acquisition programme has used the entire £3,600 contribution expected from each customer. Nothing remains for fixed overheads, risk or profit.
The commercial target must normally be lower:
Target CPL = (Customer contribution before acquisition − Required contribution) × Lead-to-sale conversion rate
In the example above, the target is £120, not £288. The difference provides the contribution the business requires after acquiring the customer.
Use three thresholds in management reporting:
| CPL threshold | Meaning |
| Planning target | The CPL expected to deliver the required profit and payback |
| Maximum test threshold | A temporary ceiling used during controlled testing |
| Break-even CPL | The point at which no contribution remains after acquisition |
Calling break-even performance “profitable” creates weak budget decisions. It may cover variable costs, but it does not necessarily support the company.
Lead-to-sale conversion determines how much a lead is worth
The same customer value produces very different CPL targets at different sales conversion rates.
Assume allowable CAC is £1,200:
| Lead-to-sale conversion | Target CPL |
| 2% | £24 |
| 5% | £60 |
| 8% | £96 |
| 10% | £120 |
| 15% | £180 |
| 20% | £240 |
If the business improves lead-to-sale conversion from 5% to 10%, it doubles the amount it can afford to pay for each comparable lead. This can unlock media volume that previously looked too expensive.
The reverse is equally important. If sales conversion falls from 10% to 5% but the marketing team continues paying £120 per lead, the effective acquisition cost doubles.
At 100 leads:
- Spend at £120 CPL: £12,000.
- Customers at 10% conversion: 10.
- Media acquisition cost per customer: £1,200.
- Customers at 5% conversion: 5.
- Media acquisition cost per customer: £2,400.
The CPL has not changed, but the commercial result has collapsed.
Decide which lead-to-sale rate belongs in the formula
Businesses frequently mix different denominators.
There are at least three useful conversion rates:
Raw lead-to-sale rate = Customers ÷ all recorded leads
Valid lead-to-sale rate = Customers ÷ valid, deduplicated leads
Qualified lead-to-sale rate = Customers ÷ qualified leads
Each can be used, but the CPL must use the same lead definition.
If you pay £10,000 and generate 200 raw leads, media CPL is £50. After removing 40 duplicates, spam submissions and ineligible enquiries, there are 160 valid leads, making the valid-lead CPL £62.50. If 80 become qualified opportunities, the cost per qualified lead is £125.
If 16 customers are acquired:
- Raw lead-to-sale rate: 16 ÷ 200 = 8%.
- Valid lead-to-sale rate: 16 ÷ 160 = 10%.
- Qualified lead-to-sale rate: 16 ÷ 80 = 20%.
All three approaches produce the same £625 media cost per customer when the corresponding CPL is used correctly:
- £50 ÷ 8% = £625.
- £62.50 ÷ 10% = £625.
- £125 ÷ 20% = £625.
Problems arise when a business multiplies raw-lead CPL by qualified-lead conversion or compares cost per qualified lead with an all-lead target.
Choose one primary definition for budget planning and display the other stages as diagnostics. For many businesses, valid leads offer a practical foundation because they exclude obvious waste without depending on subjective sales qualification.
Include sales cost in the fully loaded acquisition model
Media CPL measures the advertising cost required to create a lead. It does not include the salespeople, software and operations required to convert that lead.
Calculate both:
Media CAC = Media and lead-generation spend ÷ new customers
Fully loaded CAC = Relevant marketing and sales acquisition cost ÷ new customers
Suppose 100 leads cost £10,000 and convert into 10 customers. Media CAC is £1,000. If sales salaries, commission allocation, CRM, call tracking and agency or internal marketing resource add £5,000, fully loaded CAC is £1,500.
If the allowable total CAC is £1,800, only £300 per customer remains for additional acquisition cost before the threshold is breached. Ignoring sales cost could lead the marketing team to believe it has £800 of headroom.
A more complete CPL calculation is:
Allowable media CPL = (Allowable total CAC − Sales cost per acquired customer) × Lead-to-sale conversion rate
If allowable total CAC is £1,800, sales acquisition cost is £600 per customer and lead-to-sale conversion is 10%:
(£1,800 − £600) × 10% = £120 allowable media CPL
Traffic-to-lead conversion determines whether the target is achievable
Lead-to-sale conversion determines what a lead is worth. Traffic-to-lead conversion helps determine what that lead will cost.
Leads = Relevant visits × Visitor-to-lead conversion rate
CPL = Traffic spend ÷ leads
If £5,000 buys 2,000 relevant visits:
| Visitor-to-lead rate | Leads | CPL |
| 2% | 40 | £125.00 |
| 4% | 80 | £62.50 |
| 6% | 120 | £41.67 |
| 8% | 160 | £31.25 |
The media cost is unchanged. Improving landing-page conversion from 2% to 4% halves CPL.
However, raising form conversion is only valuable if downstream quality holds. Removing every qualifying field or offering an excessive incentive may increase leads while reducing lead-to-sale conversion.
Assess landing-page changes using the whole journey:
- Visitor-to-valid-lead conversion.
- Valid-to-qualified rate.
- Lead-to-sale conversion.
- Customer value.
- Contribution profit per visit.
The best landing page is not necessarily the one that produces the most forms. It is the one that produces the highest commercially valuable outcome from the available traffic.
A complete worked example
A business is planning a £30,000 quarterly lead-generation programme.
Its baseline economics are:
- Average first-year customer revenue: £12,000.
- Direct delivery and service costs: £6,000.
- Contribution before acquisition: £6,000.
- Required contribution after acquisition: £3,750.
- Allowable total CAC: £2,250.
- Sales cost per acquired customer: £750.
- Allowable media CAC: £1,500.
- Valid lead-to-sale conversion: 12%.
Target media CPL is:
£1,500 × 12% = £180
At £30,000 of spend, the plan can acquire approximately:
£30,000 ÷ £180 = 166 valid leads
Expected customers are:
166 × 12% = approximately 20 customers
Expected first-year revenue is:
20 × £12,000 = £240,000
Expected contribution before acquisition is:
20 × £6,000 = £120,000
After £30,000 of media and £15,000 of sales acquisition cost, £75,000 remains—equivalent to the required £3,750 contribution across 20 customers.
Now test a downside case. Lead quality weakens and conversion falls from 12% to 8%, while CPL remains £180:
- Valid leads: approximately 166.
- Customers: approximately 13.
- Media CAC: approximately £2,308.
- Sales cost at £750 each: £9,750.
- Fully loaded CAC per customer: approximately £3,058.
The £2,250 allowable CAC is breached. To retain the planned economics at an 8% conversion rate, the target media CPL needs to fall to:
£1,500 × 8% = £120
This sensitivity is why a target CPL should be recalculated when sales conversion changes materially.
How customer lifetime value should be used
For subscription, retained-service and repeat-purchase businesses, first-order or first-year value may understate what a customer is worth. Lifetime value can justify a higher acquisition cost—but only when it is realised reliably.
Use contribution-based lifetime value rather than lifetime revenue:
Customer lifetime contribution = Expected lifetime revenue − Variable lifetime delivery and servicing costs
Then apply a prudent allowance for:
- Churn and non-renewal.
- Payment failure and bad debt.
- Cohort differences.
- The time value of delayed cash flows.
- Uncertainty in immature retention data.
- The company’s required payback period.
Do not fund today’s acquisition using an optimistic five-year value if most customers leave within a year or the company cannot finance the payback delay.
Consider three customer values:
| Value basis | Appropriate use |
| First transaction or project | One-off sales and conservative cash planning |
| First-year contribution | Retained services with a defined annual view |
| Lifetime contribution | Mature cohorts with reliable retention evidence |
Set a payback limit as well as a CPL. A campaign can be profitable over three years but unsuitable for a business that requires cash recovery within six months.
Segment the target instead of relying on one average
A single target cost per lead can hide large differences in value and conversion.
Calculate separate targets where economics differ materially by:
- Service or product line.
- Customer size and contract value.
- Gross or contribution margin.
- Geography.
- New versus existing customer.
- Lead source and campaign.
- Landing page or offer.
- Sales team or territory.
- One-off versus recurring revenue.
- Sales-cycle length.
- Cancellation or refund risk.
For example:
| Segment | Allowable media CAC | Lead-to-sale rate | Target CPL |
| Local small-business service | £600 | 15% | £90 |
| Mid-market retained service | £2,000 | 8% | £160 |
| Enterprise engagement | £6,000 | 4% | £240 |
The enterprise segment has the lowest close rate but the highest supportable CPL because customer value is much greater. An account-wide £120 target might underfund enterprise growth and overspend on low-value local enquiries.
Use blended reporting for board visibility, but retain segment-level targets for budget and bidding decisions.
Measure conversion by lead cohort, not calendar sales alone
If the sales cycle lasts 60 days, leads generated this month should not be judged only against sales closed this month. Those sales may have originated from earlier marketing.
Build cohorts by lead-created month and track:
- Valid and qualified leads.
- Customers after 30, 60, 90 and 180 days.
- Mature lead-to-sale conversion.
- Revenue and contribution per cohort.
- Median time to qualification and sale.
- Cancellation, retention and expansion.
Use a mature trailing conversion rate for planning. For recent cohorts, show expected outcomes separately from realised outcomes.
This prevents two common errors: cutting a channel before its leads have matured and crediting current marketing for sales created by earlier activity.
Connect CRM outcomes back to advertising
An advertising platform cannot optimise towards profitable customers if it sees only the initial form.
Google Ads supports qualified-lead and converted-lead goals designed to measure deeper stages in the sales journey. Google recommends choosing a qualified or converted lead when configuring enhanced conversions for leads, rather than relying only on the first online submission where later CRM outcomes are available. Google Ads: qualified and converted leads
Enhanced conversions for leads can use first-party customer information and imported offline events to connect CRM outcomes with prior ad interactions. Google Ads: enhanced conversions for leads
For value-based bidding, Google advises selecting a suitable stage in the lead-to-sale journey and reporting meaningful differences in value. The final sale is the most accurate outcome, but where the delay is too long, a qualified lead may provide a more timely signal. Google Ads: value-based bidding for lead generation
The practical process is:
- Capture a stable lead identifier and permitted first-party measurement data.
- Store source, campaign and landing-page information in the CRM.
- Apply consistent qualification and sales stages.
- Import qualified and converted outcomes regularly.
- Pass values based on reliable commercial evidence.
- Validate counts, values, delays and duplicate handling.
- Change bidding only after the new signal is stable.
Do not assign arbitrary values merely to make automation run. Incorrect values teach the system to pursue the wrong prospects more efficiently.
How to manage CPL when salespeople convert differently
If representatives receive comparable leads but have different close rates, the same marketing CPL creates different customer acquisition costs.
| Representative | Valid leads | Customers | Conversion | CPL | Media CAC |
| A | 100 | 20 | 20% | £80 | £400 |
| B | 100 | 10 | 10% | £80 | £800 |
| C | 100 | 5 | 5% | £80 | £1,600 |
Before concluding that one salesperson is weaker, control for source, service, territory, customer size, lead age and allocation. Then assess:
- Speed to first response.
- Contact and meeting-booked rates.
- Discovery and qualification quality.
- Follow-up frequency.
- Proposal rate and turnaround.
- Win/loss reasons.
- CRM discipline.
- Capacity and active pipeline.
The answer may be training, routing, automation or a revised sales process—not necessarily cheaper leads.
Set a target range, not a brittle single number
Lead economics fluctuate. Customer mix, media auctions, seasonality and sales conversion change.
Use a range:
- Green: CPL is at or below the planning target and quality is stable.
- Amber: CPL is above target but below the agreed maximum test threshold; investigate and allow for normal variation.
- Red: Mature customer acquisition cost or contribution breaches the commercial limit.
Judge small campaigns over an appropriate sample. One additional sale can radically change the apparent conversion rate when volumes are low. Use rolling periods and mature cohorts, while still watching leading indicators such as qualified-lead rate and response time.
A monthly target-CPL review
Recalculate or validate the target when any of these change:
- Price, discounting or customer value.
- Product or service delivery cost.
- Sales commission or acquisition overhead.
- Refund, cancellation or churn rate.
- Lead definition or qualification criteria.
- Lead-to-sale conversion.
- Sales-cycle length.
- Channel or customer mix.
- Required margin or payback period.
The review should answer:
- What is the current contribution value per new customer?
- How much contribution must remain after acquisition?
- What is the allowable fully loaded CAC?
- What sales cost must be reserved?
- What is the mature conversion rate for the same lead definition?
- What target media CPL follows from those inputs?
- Which segments require different targets?
- Did actual customer cohorts meet the expected revenue, margin and payback?
The practical answer
Set your target cost per lead by working backwards from profitable customer value:
Target media CPL = (Allowable total CAC − Sales acquisition cost per customer) × Lead-to-sale conversion rate
If you are calculating a fully loaded CPL that already includes allocated sales cost, use:
Target fully loaded CPL = Allowable total CAC × Lead-to-sale conversion rate
Keep the lead definition consistent. Use contribution rather than revenue, reserve the profit the business requires, and base conversion on mature cohorts of comparable leads.
Then use traffic-to-lead conversion, response time, qualification and sales-stage performance to diagnose whether the target can be achieved. A higher CPL may be entirely rational for a high-value segment that closes well; a cheap lead may be expensive if it consumes sales time and rarely becomes a customer.
The objective is not to achieve the lowest CPL. It is to acquire the greatest sustainable volume of profitable customers within the company’s margin, capacity and payback constraints.
Book a Strategy Call
If your CPL target has been inherited from an advertising platform, a historic budget or an industry benchmark, Clubbish can build the commercial model around your real customer value, sales conversion and acquisition costs. We will identify what a lead is genuinely worth, where conversion is being lost and which channels can scale profitably.