
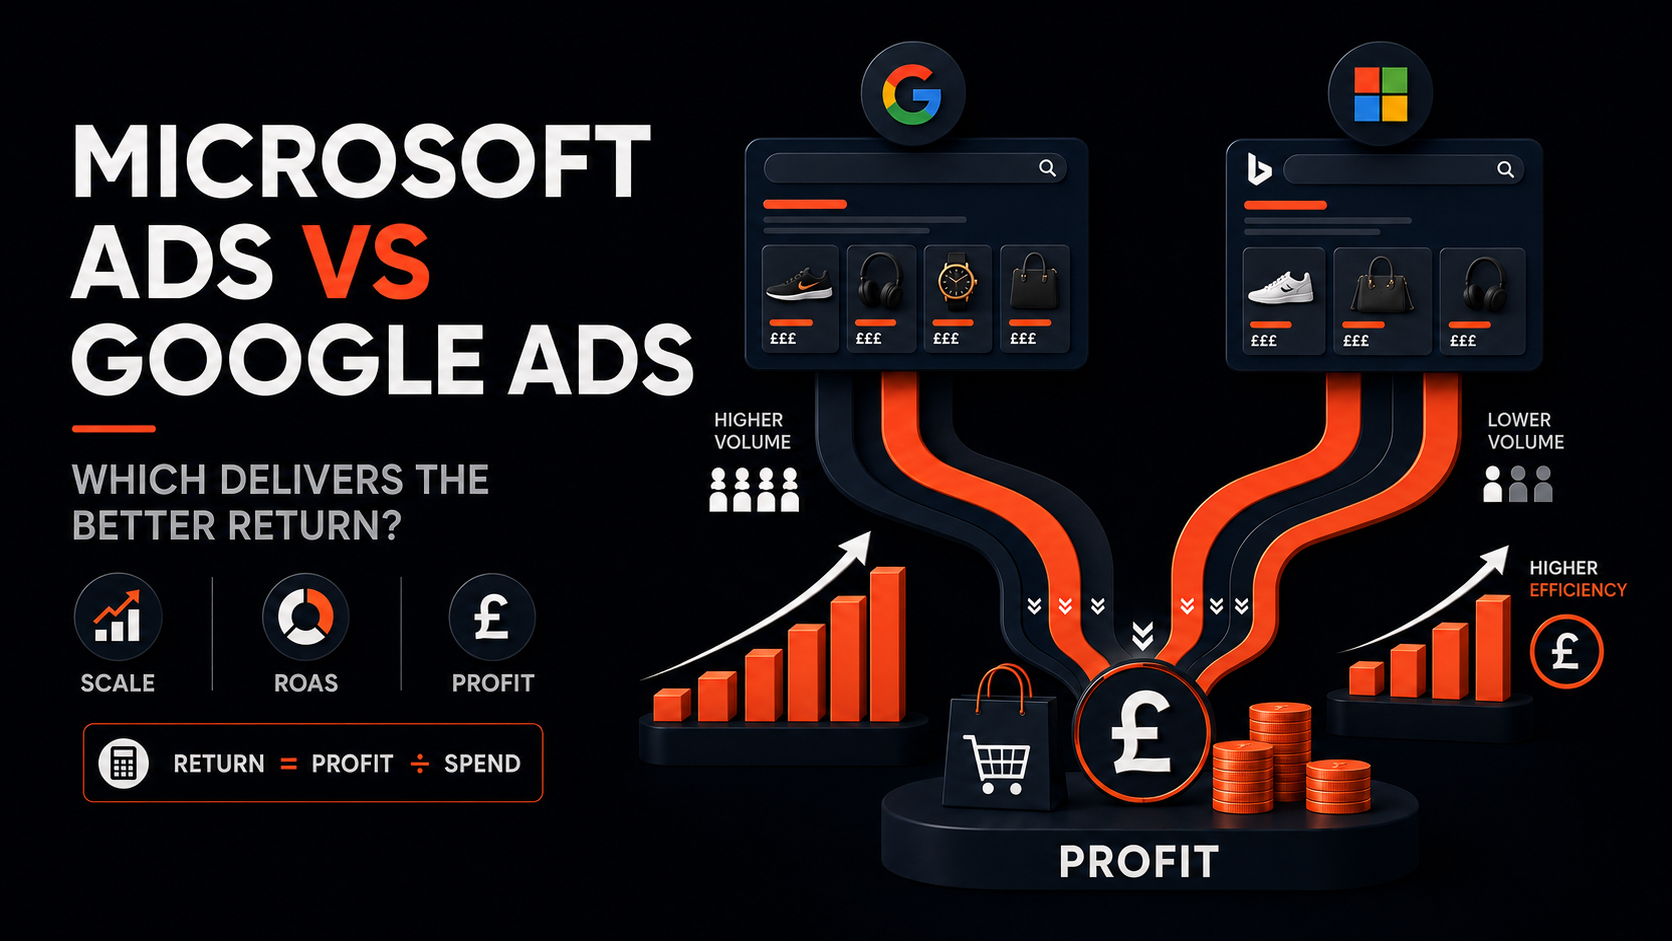
For most e-commerce businesses, Google Ads delivers the greater total return because it offers substantially more search demand, shopping volume and cross-channel scale. Microsoft Ads can sometimes deliver the better efficiency return—such as a lower CPA, higher ROAS or stronger contribution profit on the next pound spent—but usually at a lower volume.
That makes Microsoft Ads a complementary growth channel for most retailers, not a replacement for Google Ads.
The commercially useful question is therefore not simply, “Which platform has the higher ROAS?” It is:
Which platform creates the most incremental contribution profit at the level of spend we can deploy today?
That distinction matters. Google may produce more total sales and profit even with a lower ROAS. Microsoft may produce a better return on a smaller amount of marginal budget without having enough demand to absorb the whole investment.
The short answer
The winner depends on what the business means by “return”:
- If the objective is maximum revenue and order volume, Google Ads will usually win.
- If the objective is the most efficient additional sales, Microsoft Ads may outperform in selected categories and audiences.
- If the objective is new-customer growth, both platforms need to be assessed separately from brand, remarketing and returning-customer activity.
- If the objective is profit, compare contribution profit after advertising—not platform-attributed revenue alone.
- If the objective is incremental growth, test whether sales would have happened without the ads.
For an established retailer, the best answer is commonly to use Google as the core demand-capture engine and Microsoft as a controlled expansion channel. Give each platform its own budget, targets and reporting, then move the next pound towards whichever can still produce acceptable incremental profit.
Why Google usually delivers the larger total return
Google has much greater search reach in the UK. In July 2026, StatCounter estimated Google’s share of UK search across desktop and mobile at 92.62%, compared with 4.74% for Bing. On desktop, the gap was narrower: Google held 85.55% and Bing 10.77%. These figures describe search-engine usage, not advertising revenue or guaranteed customer reach, but they explain why Google normally offers considerably more scale.
Google also provides a broad e-commerce advertising ecosystem. Retailers can use Search, Shopping, Performance Max, Display, Demand Gen and YouTube activity, depending on their goals and assets. Performance Max can access Google inventory from one goal-based campaign, while Shopping campaigns use Merchant Center product data to match products with relevant searches.
This creates several advantages:
- More people searching for products, categories and brands.
- More conversion data for automated bidding and audience modelling.
- More opportunities to scale Shopping and non-brand Search.
- Broader mobile reach.
- More inventory for prospecting, remarketing and demand generation.
- Faster learning for large catalogues and high-volume retailers.
If a retailer has a strong feed, reliable purchase-value tracking, competitive products and a website that converts well, Google will normally remain the primary paid-search investment.
However, greater scale does not automatically mean every additional pound is profitable. As Google captures the strongest demand, subsequent budget increases may enter more competitive auctions, broader queries or lower-intent audiences. This is where Microsoft can become valuable.
Why Microsoft Ads can deliver better efficiency
Microsoft Advertising reaches searchers across Bing and eligible search partners. Its search network can include Microsoft properties and partner sites such as Yahoo, AOL, DuckDuckGo and Ecosia, depending on market, format and distribution settings.
The platform’s smaller audience can still be commercially meaningful. Its UK desktop share is much stronger than its overall share, so it may perform particularly well for retailers whose customers research or purchase on desktop—for example, office-based buyers, older demographics, considered purchases, business equipment, home improvement or higher-value products.
Microsoft may generate a better CPA or ROAS when:
- Fewer competitors are bidding aggressively on the same commercial searches.
- CPCs are lower without a corresponding fall in conversion rate.
- The retailer’s audience over-indexes on desktop or Microsoft environments.
- Proven Google Search and Shopping demand transfers effectively.
- The catalogue contains strong-margin products with clear purchase intent.
- Microsoft adds buyers who would not otherwise have been reached through Google.
But cheaper clicks alone do not equal a better return.
CPA can be expressed as:
CPA = CPC ÷ conversion rate
If Google traffic costs £1.50 per click and converts at 3%, its CPA is £50. If Microsoft traffic costs £1.00 but converts at 1.5%, its CPA is £66.67. Microsoft has the cheaper traffic but the more expensive customer.
The complete calculation must include order value, product margin, returns, fulfilment and customer quality.
Compare profit, not just platform ROAS
ROAS is useful, but it measures attributed revenue divided by advertising spend:
ROAS = attributed revenue ÷ ad spend
It does not account for cost of goods, fulfilment, payment fees, returns, discounting or whether the sale would have occurred anyway.
A better commercial measure is contribution profit after advertising:
Contribution profit after ads = revenue − product costs − fulfilment − payment fees − returns allowance − ad spend
Consider this illustrative comparison:
| Metric | Google Ads | Microsoft Ads |
|---|---|---|
| Ad spend | £40,000 | £5,000 |
| Attributed revenue | £160,000 | £22,500 |
| ROAS | 4.0x | 4.5x |
| Pre-ad contribution margin | 35% | 38% |
| Contribution before ads | £56,000 | £8,550 |
| Contribution profit after ads | £16,000 | £3,550 |
Microsoft reports the higher ROAS and stronger percentage efficiency. Google still produces more than four times as much contribution profit because it operates at greater scale.
Calling Microsoft the “winner” would therefore be misleading if the business needs the highest total profit. Calling Google the winner would also be incomplete if the next slice of budget can earn a better marginal return on Microsoft.
The marginal return decides the next investment
Average account performance tells you what historic spend achieved. A budget decision concerns what the next pound is likely to achieve.
Imagine the retailer has another £5,000 to invest:
| Next £5,000 invested | Google Ads | Microsoft Ads |
| Forecast incremental revenue | £15,000 | £20,000 |
| Marginal ROAS | 3.0x | 4.0x |
| Pre-ad contribution margin | 35% | 38% |
| Contribution before ads | £5,250 | £7,600 |
| Incremental contribution after ads | £250 | £2,600 |
In this scenario, Google remains the larger platform overall, but Microsoft is the better destination for the next £5,000. Once Microsoft’s available demand is exhausted, the marginal return may fall and the next allocation could change again.
This is why a fixed 90/10 or 80/20 budget split should be treated as a starting hypothesis, not a permanent rule.
Google Ads vs Microsoft Ads by commercial factor
| Factor | Google Ads | Microsoft Ads |
| Search scale | Usually the clear leader | Smaller, incremental demand pool |
| Mobile opportunity | Much stronger overall reach | Typically more desktop-weighted |
| Shopping | Large product-search ecosystem through Merchant Center | Product Ads through Microsoft Merchant Center |
| Automated reach | Strong through Performance Max and other campaign types | Automation available, but with less conversion volume in many accounts |
| Data volume | Often faster learning and more stable optimisation | Can struggle where conversion volume is low |
| Auction competition | Often intense in commercial categories | May be lighter, but not always |
| Setup | Requires its own feed, tracking and account structure | Google campaigns can be imported, reducing initial build time |
| Best role | Core demand capture and scalable growth | Additional profitable search and shopping demand |
| Main risk | Rising CPCs and declining marginal efficiency | Low volume, weak learning signals and overestimating audience opportunity |
Search campaigns: compare the same intent
A fair platform comparison requires like-for-like segmentation.
Do not compare a Google account containing broad non-brand acquisition with a Microsoft account dominated by branded search. Brand campaigns normally convert at a higher rate because customers already know the retailer. The result would say more about search intent than platform quality.
Separate at least:
- Brand Search.
- Non-brand category and product Search.
- Competitor Search.
- Dynamic Search Ads.
- Remarketing audiences.
- New and returning customers.
Then compare query quality, CPC, conversion rate, average order value, new-customer CPA and contribution profit within equivalent groups.
Microsoft’s Google Import feature can accelerate setup by transferring eligible campaigns, but an imported structure should not be left unattended. Search demand, partner distribution, match behaviour, audience size and conversion volume differ. Budgets, bid targets, negatives and location settings must be reviewed for Microsoft rather than inherited blindly.
Shopping campaigns: the feed determines both platforms’ potential
Google Shopping and Microsoft Product Ads both depend heavily on product data. A weak feed limits relevance and profitability regardless of platform.
Review:
- Product titles aligned with the language shoppers use.
- GTIN, MPN and brand accuracy.
- Product type and category structure.
- Price and sale-price consistency.
- Availability and stock updates.
- Variant data such as colour, size, material and gender where relevant.
- High-quality images.
- Shipping cost and delivery estimates.
- Returns information.
- Custom labels for margin, stock, seasonality, bestseller status and price band.
Google uses a linked Google Merchant Center account for Shopping activity. Microsoft Shopping uses a Microsoft Merchant Center store and catalogue. Although the source data may be shared, each destination needs its own diagnostics, approvals and performance review.
Avoid using one blended ROAS target across a catalogue with radically different economics. A 3x return may be profitable for a 60%-margin accessory and unprofitable for a 25%-margin appliance. Segment products or pass profit-informed conversion values so bidding reflects the outcome the business actually values.
Performance Max does not create a direct like-for-like comparison
Google Performance Max can serve across Search, Shopping, YouTube, Display, Gmail, Maps and other Google inventory. Microsoft Search or Shopping activity may have a narrower role.
Comparing their top-line ROAS therefore risks comparing different jobs:
- Google may be prospecting, remarketing and capturing product search in one campaign.
- Microsoft may be serving mainly high-intent searchers.
- Google may receive more new-customer exposure but show a lower immediate return.
- Microsoft may report higher efficiency because it operates closer to purchase.
Break performance down by campaign purpose and customer type. If Google is expected to create demand while Microsoft only captures it, a direct ROAS league table will encourage the business to cut the activity doing the harder work.
Audience fit can change the result
Microsoft is more likely to contribute meaningfully when the retailer sells products suited to desktop research or a workplace-influenced audience. Examples might include:
- Furniture and home improvement.
- Computing, office equipment and software-adjacent products.
- High-value electricals.
- Finance-conscious or considered purchases.
- Specialist equipment.
- Gifts purchased during working hours.
- Products with older or more affluent buyer groups.
Google is generally stronger where the shopping journey is highly mobile, the category depends on vast query coverage, or the business needs large-scale prospecting.
These are hypotheses, not targeting rules. Use device, demographic, product and customer data from the retailer’s own account before assuming that one audience profile will perform.
New customers matter more than cheap returning sales
A platform can show a high ROAS by converting customers who already know the brand. That does not necessarily create growth.
Report separately:
- New-customer revenue.
- Returning-customer revenue.
- New-customer CPA.
- First-order contribution profit.
- Repeat-purchase rate.
- Customer lifetime value.
- Payback period.
If Microsoft achieves a 5x ROAS largely through returning customers, while Google achieves 3.5x from genuinely new buyers with strong repeat value, Google may be the better growth investment. Conversely, Microsoft may uncover incremental new customers at a lower acquisition cost than saturated Google campaigns.
Where reliable customer lists and platform settings permit, use customer-acquisition reporting and exclusions carefully—but reconcile the platform’s classification with the commerce database. Advertising platforms should not be the only source of truth for customer status.
Attribution is not incrementality
Both platforms report conversions according to their tracking and attribution rules. Neither number proves that the advertising caused every sale.
A customer may see an email, search the retailer’s name on Bing or Google, click a paid brand ad and purchase. The platform may correctly take attribution credit under the configured model, even though the customer might have bought through an organic result or direct visit without the ad.
Over-credit risk is highest in:
- Brand Search.
- Remarketing.
- Existing-customer campaigns.
- Promotional peaks.
- Campaigns targeting customers already close to purchasing.
Assess incrementality by watching what happens to total store outcomes as investment changes. Where scale allows, use controlled geographic tests, audience holdouts or well-designed time-based experiments. The objective is to estimate:
Incremental contribution profit = profit from sales caused by ads − advertising investment
This is more decision-useful than asking which platform claimed the most revenue.
A practical budget-allocation model
For a retailer with a mature Google account but no meaningful Microsoft presence, a controlled starting model could be:
| Investment stage | Indicative allocation | Purpose |
| Core Google programme | 85–95% | Maintain proven Search, Shopping and PMax demand capture |
| Microsoft test | 5–15% | Validate incremental demand using proven products and queries |
This is not a benchmark or recommendation for every account. It is a way to protect the core business while collecting enough Microsoft data to make a decision.
The Microsoft test should begin with:
- High-margin or strategically important bestsellers.
- Proven non-brand Search themes from Google.
- Clean Shopping feed data.
- Separate brand and non-brand campaigns.
- Search activity separated from broader audience-network inventory.
- Independent conversion tracking and revenue reconciliation.
- A pre-agreed profit threshold and maximum test budget.
If Microsoft meets the threshold, increase spend gradually. If it runs out of eligible demand, do not force scale by weakening targets until the apparent growth becomes unprofitable.
A 90-day comparison plan
Before launch
- Reconcile Google purchase volume and revenue with the commerce platform.
- Calculate target CPA and break-even ROAS from contribution margin.
- Segment Google performance by brand, non-brand, Shopping, PMax, product group and customer status.
- Configure Microsoft conversion tracking and verify transaction values and currency.
- Build or import only the structures suitable for a controlled comparison.
- Record total store revenue, contribution profit, new customers and blended marketing efficiency.
Days 1–30: validate delivery and data
- Check product approvals and feed accuracy.
- Review search terms, partner traffic and location settings.
- Confirm purchase values and transaction counts against store data.
- Identify obvious irrelevant demand, tracking duplication or landing-page errors.
- Avoid judging the platform from a small number of conversions.
Days 31–60: assess comparable segments
- Compare non-brand Search with non-brand Search.
- Compare similar product groups at equivalent margin bands.
- Review CPC, conversion rate, CPA, AOV, ROAS and contribution profit.
- Separate new customers from returning customers.
- Examine device and geographic differences.
Days 61–90: make the allocation decision
- Estimate incremental revenue and contribution profit.
- Compare the marginal return from the next budget increase on each platform.
- Scale Microsoft only where qualified demand remains.
- Reallocate weak Microsoft spend rather than keeping it for channel diversity alone.
- Avoid cutting Google solely because Microsoft reports a higher average ROAS at a fraction of the volume.
The scorecard a marketing director should receive
| Measure | Why it belongs in the report |
| Spend | Shows the investment required to generate the result |
| Orders and revenue | Provides volume and top-line context |
| CPC and conversion rate | Explains whether efficiency comes from media cost or traffic quality |
| CPA and ROAS | Useful channel diagnostics |
| Contribution profit after ads | Establishes actual first-order commercial return |
| New-customer CPA | Shows whether the platform is acquiring growth |
| Repeat rate and LTV | Captures value beyond the first transaction |
| Brand/non-brand split | Prevents existing demand from obscuring acquisition performance |
| Blended MER | Tests whether platform growth appears in total business results |
| Marginal contribution return | Guides the next budget decision |
The report should also show absolute pounds, not percentages alone. A channel producing £3,000 of profit at a 6x ROAS is not automatically more important than one producing £100,000 of profit at 4x.
Common mistakes when comparing Microsoft Ads and Google Ads
Comparing different attribution settings
If the conversion windows, attribution models or purchase definitions differ, the reported returns are not comparable. Document the settings and reconcile both platforms against the same commerce data.
Treating imported campaigns as finished campaigns
Google Import reduces build time; it does not remove the need for Microsoft-specific optimisation. Review budgets, bids, queries, partners, feeds, audiences and exclusions after import.
Comparing account averages
An account average blends brand, non-brand, Shopping, prospecting, remarketing and customer retention. Compare equivalent commercial roles.
Assuming lower CPC means higher profit
Conversion rate, order value, margin, returns and customer quality determine whether a cheaper click is valuable.
Forcing Microsoft to match Google’s scale
Microsoft may be an excellent marginal channel without having enough relevant demand to absorb a large budget. Expanding beyond that point can rapidly weaken efficiency.
Ignoring total business performance
If reported platform revenue grows but store revenue, new customers and contribution profit do not, the platforms may be receiving more credit rather than creating more demand.
Using the same target for every product
Different products have different margins, return rates and customer value. Targets should reflect those economics.
Which platform should receive the next £10,000?
Use this decision sequence:
- Is tracking reliable? If not, invest in measurement before media.
- Is Google profitable at the margin? If proven campaigns are budget-constrained and the next spend meets the contribution target, Google may remain the priority.
- Has Microsoft been tested properly? If not, reserve a controlled budget for proven queries and products.
- Which platform adds new customers? Separate acquisition from brand and existing-customer demand.
- Which produces more incremental contribution profit? Use the same commercial assumptions for both.
- Can the winner absorb the budget? High efficiency at tiny volume does not guarantee scalable return.
- What is the payback requirement? A cash-constrained retailer may choose the faster return even if another channel offers higher long-term value.
The allocation can change each month as auction conditions, stock, seasonality, product margin and available demand change.
The practical answer
So, Microsoft Ads vs Google Ads: which delivers the better return for e-commerce?
Google Ads will usually deliver the larger return in pounds because it offers far greater search demand, shopping volume, mobile reach and opportunities to scale. Microsoft Ads can deliver a stronger return on a smaller, incremental slice of budget—particularly for desktop-led audiences, strong-margin products and proven search demand.
Do not choose one platform from a generic ROAS benchmark. Use Google as the core channel where it remains incrementally profitable, test Microsoft as an additional source of customers, and allocate each new pound according to contribution profit, customer quality and available scale.
The best platform is not the one that claims the most revenue or reports the most attractive percentage. It is the one that causes the next profitable sale at a return the business can sustain.
Frequently asked questions
Is Microsoft Ads cheaper than Google Ads for e-commerce?
Microsoft may have lower CPCs in some auctions, but this is not guaranteed. A cheaper click only improves return if the traffic converts, produces suitable order values and generates enough contribution profit after costs and returns.
Should an e-commerce business run Microsoft Ads before Google Ads?
Usually not. Google generally provides more search and shopping demand, making it the logical core channel for most UK retailers. Microsoft is commonly introduced after Google tracking, feeds and profitable campaigns are functioning reliably.
Can Microsoft Ads replace Google Ads?
For most e-commerce businesses, no. Microsoft normally lacks the volume to replace Google, particularly on mobile. It is better treated as a complementary source of profitable demand.
Can Google Shopping campaigns be imported into Microsoft Ads?
Microsoft provides Google Import for eligible campaign structures, which can reduce setup time. Imported campaigns still require Microsoft-specific tracking, budgets, search-query checks, feed diagnostics and profitability management.
Should Google Ads and Microsoft Ads use the same ROAS target?
Not automatically. Targets should reflect product margin, customer mix, return rates, available demand and the commercial role of each campaign. Use the same underlying profit framework, but allow platform and campaign targets to differ.
How long should a Microsoft Ads test run?
A 60–90-day test is a useful starting framework for many established retailers, but conversion volume matters more than elapsed time. The test needs enough qualified traffic and purchases to distinguish performance from normal variation.
Which platform is better for acquiring new customers?
Either can win depending on the category and audience. Separate brand, remarketing and returning-customer activity, then compare new-customer CPA, first-order contribution and lifetime value.
Need an independent view of your paid-search investment?
Clubbish helps e-commerce teams assess Google and Microsoft Ads through the commercial measures that matter: contribution profit, customer acquisition, incrementality and scalable marginal return.
If you need to decide whether Microsoft can add profitable reach—or whether your next budget increase should remain with Google—book a marketing strategy consultation with Clubbish.