
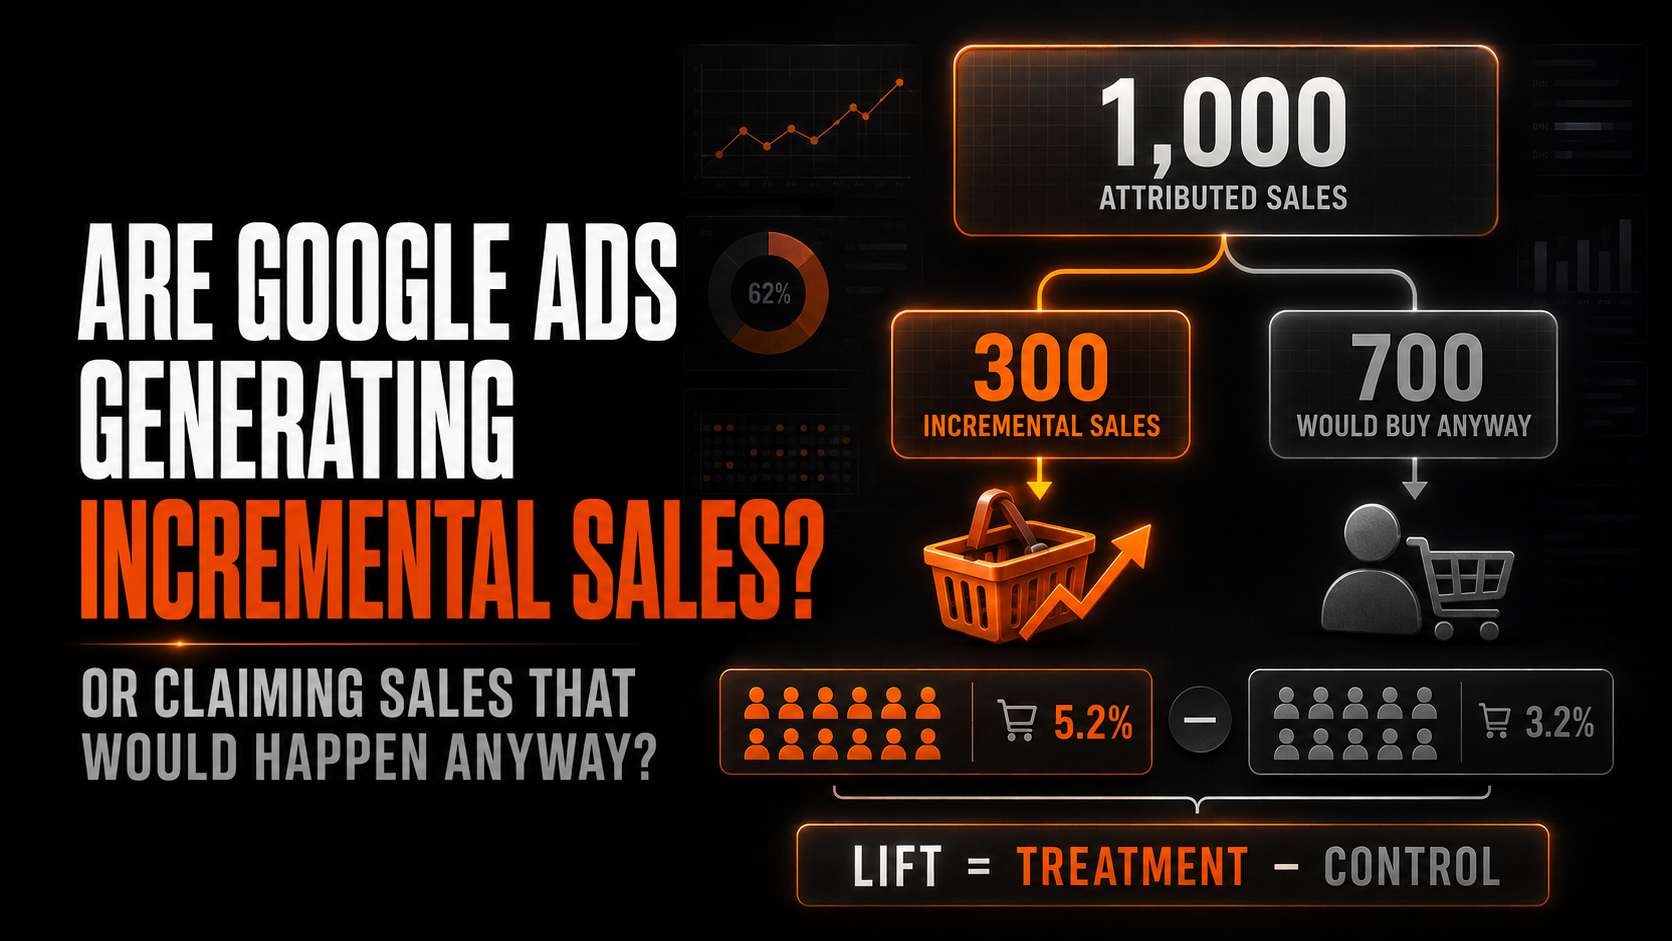
Google Ads may be generating incremental sales, taking credit for customers who would have purchased anyway—or doing both at the same time.
Standard attribution tells you which advertising interaction received credit for a purchase under a chosen set of rules. It does not prove that the advertising caused the purchase.
To establish whether Google Ads is creating additional sales, the business needs a credible counterfactual: what would have happened to orders, revenue and profit if a comparable group of customers had not been exposed to the advertising?
The strongest way to answer that question is an incrementality test that compares an exposed treatment group with a deliberately unexposed control group. The commercial result should then be assessed using incremental contribution profit, not attributed revenue alone.
For a marketing director, the key question is not:
“How much revenue did Google Ads report?”
It is:
“How much additional profit did Google Ads cause?”
Attribution is not causation
A customer sees an email, searches for the retailer’s name, clicks a paid Brand Search advert and completes a purchase.
Google Ads can correctly attribute that order to the paid click under the selected attribution model. However, the customer might have reached the site through the organic result, typed the address directly, used a bookmark or clicked the email if the advert had not appeared.
The attributed order is real. What remains unknown is whether the ad changed the outcome.
Attribution answers:
Which recorded touchpoint should receive credit?
Incrementality answers:
Did advertising create an outcome that would not otherwise have occurred?
Google explains that attribution models determine how credit is allocated between ad interactions on the path to conversion. Data-driven attribution uses account data to distribute that credit, while last-click attribution assigns it to the final eligible interaction. Google Ads: Attribution models
Neither method creates a no-ad control group. Changing the attribution model can redistribute credit without changing the number of customers who purchased.
What is an incremental sale?
An incremental sale is a purchase that occurred because of advertising and would not have happened during the measured period without that advertising.
In a simplified controlled test:
Incremental conversions = Treatment-group conversions − Expected control-group conversions
The comparison must adjust for group size and the experimental design. It is not normally valid to subtract two raw totals from unequal groups without normalisation.
Imagine that Google Ads reports 1,000 attributed purchases. A properly designed lift study estimates that advertising caused 300 additional purchases.
| Measure | Result |
|---|---|
| Attributed purchases | 1,000 |
| Estimated incremental purchases | 300 |
| Purchases expected without ads | 700 |
| Incrementality rate | 30% |
The remaining 700 orders are not necessarily “fake” conversions. They are genuine purchases that the test estimates would have happened anyway through existing demand, other marketing, direct navigation, organic search or normal customer behaviour.
This distinction changes the economics dramatically.
Attributed ROAS versus incremental ROAS
Attributed ROAS is:
Attributed ROAS = Attributed conversion value ÷ ad spend
Incremental ROAS is:
Incremental ROAS = Incremental conversion value ÷ ad spend
Suppose a campaign spends £50,000 and Google Ads attributes £250,000 of revenue:
Attributed ROAS = £250,000 ÷ £50,000 = 5.0x
A lift test estimates that only £120,000 of the revenue was incremental:
Incremental ROAS = £120,000 ÷ £50,000 = 2.4x
If the products have a 40% pre-ad contribution margin:
Incremental contribution before ads = £120,000 × 40% = £48,000
Incremental contribution after ads = £48,000 − £50,000 = −£2,000
The campaign appears highly successful at 5x attributed ROAS but destroys £2,000 of incremental contribution in this illustrative example.
The correct budget decision would be very different from the one suggested by the platform headline.
Where over-attribution risk is highest
Every campaign should be measured carefully, but some areas carry greater risk of receiving credit for demand that already existed.
Brand Search
Someone searching the exact retailer name already demonstrates strong awareness and intent. Paid Brand Search may still create value by protecting visibility, controlling messaging, promoting an offer, supporting mobile navigation or defending against competitors.
However, its extremely high ROAS should not automatically be interpreted as customer acquisition. Some customers would click the organic result if the paid advert disappeared.
Remarketing
Remarketing targets people who have already visited, viewed a product, joined a list or added to basket. These users are closer to purchase than a cold audience and therefore tend to convert more efficiently.
The campaign may assist, remind or accelerate the purchase, but its attributed ROAS includes customers who may have returned without another paid impression.
Existing-customer campaigns
A loyal customer searching for a familiar product may purchase regardless of whether an advert appears. Paid media can influence timing, basket size or product choice, but repeat demand should not be valued as if every sale represents a newly acquired customer.
Performance Max
Performance Max can operate across Search, Shopping, YouTube, Display, Gmail, Demand Gen, Images and Maps. Strong aggregate performance may combine prospecting, brand demand, remarketing and product-search activity.
That breadth can create incremental demand, but it can also make the source of attributed performance harder to interpret without channel, product, customer and lift analysis.
Promotional periods
During Black Friday, a major sale or a product launch, customer demand may rise because of the offer, email, PR, social activity or wider market behaviour. Google Ads can capture that demand and receive attribution even where the promotion was the principal cause.
High organic brand visibility
If the business ranks first organically for its own name and has strong direct traffic, paid brand clicks may substantially overlap with existing routes to purchase.
Warning signs that Google Ads may be over-credited
These signals do not prove non-incrementality, but they justify closer investigation.
| Signal | What it may indicate |
| Paid Brand Search reports exceptionally high ROAS | Ads may be intercepting people already intending to buy |
| Google Ads spend rises while total store revenue remains flat | Conversion credit may be shifting without net-new demand |
| Google Ads revenue rises while blended MER declines | Platform performance is improving faster than the business |
| Remarketing dramatically outperforms prospecting | The account may rely on people already close to purchase |
| Most paid orders come from returning customers | Existing demand may be receiving acquisition credit |
| PMax ROAS rises while direct and organic revenue fall | Channel attribution may be moving rather than total demand growing |
| Pausing a campaign produces little change in total orders | The activity may have limited incremental effect |
| Branded clicks increase but branded search demand does not | Ads may be capturing a larger share of the same demand |
| Platform revenue exceeds a plausible share of total revenue | Overlap, duplicated tracking or attribution boundaries require review |
Use several signals together. Total revenue may stay flat because stock declined, another channel weakened or market demand fell—even when Google Ads created incremental value.
Signs that Google Ads may be genuinely incremental
Positive signals also require testing, but include:
- Total store orders and contribution profit rise with spend.
- New-customer volume increases rather than merely shifting channel credit.
- Non-brand product and category campaigns create sales in previously underdeveloped segments.
- Geographic areas receiving extra media outperform credible control regions.
- Sales decline meaningfully in a holdout group where ads are withheld.
- Branded search, direct visits or email sign-ups grow after upper-funnel activity.
- New customer cohorts repay acquisition costs within the expected period.
- Incremental lift persists after accounting for promotions, price, stock and seasonality.
No single dashboard pattern is a substitute for a control group, but these trends help prioritise what to test.
How Google Conversion Lift works
Google’s Conversion Lift is designed to measure the causal effect of advertising.
In a user-based study, eligible users are separated into:
- A treatment group that can be shown the selected ads
- A control group that is intentionally withheld from those ads
The difference in downstream conversion behaviour is used to estimate lift attributable to the campaign.
Google’s reporting can include:
- Incremental conversions
- Relative conversion lift
- Incremental conversion value
- Incremental CPA
- Incremental ROAS
Google defines incremental CPA as total cost divided by incremental conversions and incremental ROAS as incremental conversion value divided by total spend. Google Ads: About Conversion Lift
This produces a different answer from normal conversion reporting because the objective is to estimate causality rather than distribute credit along observed paths.
Conversion Lift eligibility, supported campaign types, minimum data requirements and available study designs can vary by account. Some configurations require support from a Google account representative.
User-based versus geography-based testing
User-based Conversion Lift
This approach creates treatment and control groups from eligible users. It is useful when the platform can randomise exposure and observe sufficient conversion volume.
Advantages include:
- Strong experimental control
- Direct comparison between exposed and withheld groups
- Reduced reliance on finding naturally similar regions
- Lift reporting linked to selected campaigns and conversion actions
Limitations include:
- Not all accounts or campaigns are eligible
- Required spend and conversion volume may be substantial
- Identity, consent and observability affect measurement
- The result applies to the tested conditions, audience and period
Geography-based Conversion Lift
Geo testing separates comparable regions into treatment and control groups. Ads run in treatment areas and are withheld or reduced in control areas.
Google describes geography-based Conversion Lift as a controlled experiment comparing regions where ads run with regions where ads do not run. Supported use cases can include Search, Shopping and Performance Max as well as other campaign types, subject to eligibility. Google Ads: Geography-based Conversion Lift
Advantages include:
- Ability to measure total geographic outcomes
- Potential inclusion of online and offline results
- Cross-channel measurement in one study
- Reduced dependence on user-level identity
Limitations include:
- Geographic areas must be sufficiently comparable
- Customers can travel or purchase across boundaries
- Regional promotions, weather, competition and stock can contaminate results
- National campaigns and small markets may make clean separation difficult
How to design a credible geo holdout
Where a platform-led lift study is unavailable, a carefully designed geo experiment can still provide strong evidence.
Build a stable pre-test baseline
Collect sufficient historic data by region, including:
- Orders and revenue
- Contribution margin
- New customers
- Organic and direct traffic
- Google Ads spend and clicks
- Promotions
- Stock availability
- Delivery performance
- Other media activity
The baseline should cover seasonality and establish whether regions move similarly before treatment.
Match comparable regions
Match on factors such as:
- Historic revenue and trend
- Population and customer density
- Product demand
- Average order value
- New-customer rate
- Media exposure
- Delivery economics
- Competitive intensity
Avoid choosing the strongest areas as treatment and weakest as control. That builds bias into the test.
Define the intervention
Specify exactly what will change:
- Pausing Brand Search
- Removing remarketing
- Adding or withholding PMax
- Increasing non-brand Search spend
- Testing a new customer-acquisition structure
Do not change multiple unrelated marketing programmes only in the treatment regions.
Predefine the outcome
Choose one primary metric, such as:
- Incremental contribution profit
- Incremental new-customer orders
- Incremental revenue
- Incremental ROAS
- Incremental CPA
Secondary metrics can help explain the result, but changing the success definition after seeing the data weakens the conclusion.
Control contamination
Keep price, promotions, stock, delivery and other media as consistent as possible. Track exceptions and assess whether they could explain the measured difference.
Run for sufficient time
The test must produce enough outcomes to detect a commercially meaningful difference and accommodate conversion delay. A low-volume retailer may need a longer test or larger geographic groups.
Analyse uncertainty
A positive point estimate is not automatically conclusive. Review confidence or credible intervals, detectable effect, statistical power and practical commercial significance.
Why simply pausing everything is weaker
A full-account before-and-after pause appears straightforward:
- Record sales with advertising on.
- Pause Google Ads.
- Observe what happens.
The problem is that time changes many things simultaneously:
- Customer demand
- Competitor activity
- Promotions
- Email volume
- Organic rankings
- Stock
- Pricing
- Weather
- Paydays
- Trading days
- Other advertising
If revenue falls after the pause, Google Ads may have caused the difference—or the market may simply have weakened.
A randomised user holdout or matched geo control observes treatment and comparison groups during the same period, reducing these time-based confounders.
A pause can still provide directional evidence when no better design is practical, especially for a concentrated brand campaign. Treat the result cautiously and repeat it where possible.
Test Brand Search separately
Brand Search is often the best first incrementality question because the risk of existing intent is high and the campaign is easy to identify.
Do not assume the answer is always to switch it off. Brand advertising may:
- Defend against competitor bidding
- Control the message and landing page
- Promote a sale or key proposition
- Occupy more mobile screen space
- Route users to high-converting destinations
- Support misspellings or ambiguous brand searches
- Create lift where organic coverage is weak
Potential test structures include:
- Geographic brand holdouts
- Time-based switchbacks in matched periods
- Audience exclusions where practical
- Query-level analysis separating exact brand, brand-plus-product and generic searches
Measure total paid plus organic brand clicks, total orders, new customers and contribution—not the paid campaign alone.
If paid clicks fall by 10,000 but organic brand clicks rise by 8,000 and total sales barely change, much of the paid traffic may have been substitutive. If total orders and profit fall materially, the ads were creating or protecting value.
Test remarketing separately
Remarketing audiences begin with prior contact, so their baseline purchase probability is already higher.
Test whether remarketing:
- Creates purchases that would not otherwise occur
- Accelerates the purchase
- Increases basket value
- Reduces the chance that customers buy from a competitor
- Produces more repeat purchases
Use a holdout group that remains eligible to buy but is withheld from the advertising. Compare not just immediate orders but conversion timing, AOV, discounts, returns and contribution.
A campaign can produce limited incremental order count while shortening the time to purchase. Whether that acceleration has value depends on cash flow, competition and the product cycle.
Evaluate Performance Max beyond its headline ROAS
Performance Max should be broken down and tested because it can serve across multiple types of inventory and intent.
Review:
- Channel performance
- Search categories and available query insight
- Brand versus non-brand exposure
- Product-level spend and margin
- New versus returning customers
- Asset-group performance
- Audience and customer-acquisition settings
- Direct and organic channel movement
- Total-store results
Performance Max experiments can test uplift or compare PMax with other campaign configurations where the account is eligible. The commercial interpretation should still use contribution and customer value rather than conversion count alone.
Measure the right outcome
A positive conversion lift is not automatically profitable.
Calculate:
Incremental revenue = Incremental orders × incremental AOV
Incremental gross contribution = Incremental revenue × pre-ad contribution margin
Incremental contribution after ads = Incremental gross contribution − advertising spend
Incremental contribution ROI = (Incremental gross contribution − advertising spend) ÷ advertising spend × 100
Suppose a lift study estimates:
| Metric | Result |
| Ad spend | £60,000 |
| Incremental orders | 1,200 |
| Incremental AOV | £125 |
| Incremental revenue | £150,000 |
| Pre-ad contribution margin | 45% |
| Incremental gross contribution | £67,500 |
| Incremental contribution after ads | £7,500 |
| Incremental contribution ROI | 12.5% |
The incremental ROAS is 2.5x, which may look weak beside a 5x attributed ROAS. Yet the campaign remains contribution-positive. The business must decide whether £7,500 is sufficient given fixed costs, risk, cash flow and alternative uses of the £60,000.
New-customer incrementality matters
Separate order lift from customer-acquisition lift.
Advertising may generate additional orders primarily from existing customers. That can be valuable, but it is different from increasing the customer base.
Track:
- Incremental new customers
- Incremental returning customers
- Incremental new-customer CPA
- First-order contribution
- Repeat-purchase rate
- Payback period
- Realised customer contribution over time
If the first order is acquired below break-even, use conservative cohort evidence to justify future value. Do not assume every new customer will repeat at the historic average if the scaled campaign attracts a different customer mix.
Use blended measures as an early warning system
Incrementality tests cannot run continuously across every campaign. Blended business measures help identify when platform reporting and commercial reality diverge.
Blended MER
Blended MER = Total store revenue ÷ total marketing spend
If Google Ads ROAS improves while blended MER declines, investigate whether advertising is receiving more credit without generating proportional business growth.
Contribution after marketing
Track total contribution after all media costs. This avoids celebrating channel revenue while overall profit falls.
New-customer CAC
Measure total acquisition spend against genuinely new customers across channels. This is more difficult for Google Ads to claim independently but more useful for company planning.
Channel movement
Monitor paid, organic, direct, email and affiliate revenue together. A rise in paid attribution accompanied by an equal fall elsewhere may indicate reallocation rather than incrementality.
These measures do not prove causality. They tell the team where controlled testing is most valuable.
A practical testing sequence
Step 1: Reconcile the measurement
Compare Google Ads purchase value with GA4, the commerce platform, settled orders, refunds and cancellations. Fix duplicate or missing transactions before testing incrementality.
Step 2: Segment overlap risk
Separate:
- Brand and non-brand
- Prospecting and remarketing
- New and returning customers
- Search, Shopping and PMax
- Product categories and margin bands
Step 3: Prioritise the first test
Choose a campaign with meaningful spend, plausible over-attribution and enough volume to detect a commercially useful effect. Brand Search, remarketing and PMax are common candidates.
Step 4: Define success in advance
Set the minimum incremental contribution profit, new-customer lift, incremental ROAS or acceptable payback required to retain or increase the budget.
Step 5: Select the strongest feasible design
Use user-based Conversion Lift where eligible, geography-based lift or a matched geo holdout where suitable, and a cautious switchback or pause only when stronger designs are impractical.
Step 6: Protect the experiment
Keep promotions, pricing, stock and other media stable where possible. Document every exception.
Step 7: Calculate the commercial result
Translate lift into revenue, gross contribution, contribution after ads, new customers and payback.
Step 8: Reallocate budget
Reduce, restructure or constrain activity with weak incremental profit. Increase budgets where incremental outcomes remain commercially attractive.
How to respond to different outcomes
| Test result | Likely action |
| High attributed ROAS and high incremental profit | Scale while monitoring marginal returns |
| High attributed ROAS but weak lift | Reduce, narrow or restructure; investigate brand and remarketing overlap |
| Modest attributed ROAS but strong incremental new-customer value | Consider scaling within payback constraints |
| Positive sales lift but negative contribution | Improve margin, targeting or cost before scaling |
| Inconclusive test | Do not declare success or failure; improve power or repeat |
| Different results by region or customer group | Reallocate towards areas with stronger incremental economics |
An inconclusive result does not prove zero effect. It means the study could not confidently distinguish the effect from noise under the tested conditions.
Common incrementality mistakes
Calling data-driven attribution incremental
Data-driven attribution reallocates credit using observed conversion paths. It does not create an unexposed control group.
Testing too little spend or too few conversions
An underpowered experiment may miss a commercially real effect and produce a wide range of plausible outcomes.
Changing promotions during the test
If treatment regions receive a stronger offer, the test measures the combined effect of advertising and promotion.
Selecting control regions after seeing the result
Post-hoc matching can introduce bias. Define the design before launch.
Measuring only platform conversions
Channel substitution may be invisible inside the Google Ads report. Include total-store outcomes.
Ignoring profit
Incremental revenue can still be unprofitable after product cost, fulfilment, returns and media.
Assuming incrementality is permanent
Results can change with brand awareness, competition, seasonality, creative, customer mix and spend level. Retest material budget areas periodically.
Applying one campaign’s lift rate everywhere
Brand Search, generic Shopping, PMax prospecting and remarketing have different baseline probabilities and roles. Do not use one universal incrementality multiplier without evidence.
Questions directors should ask
- What proportion of Google Ads revenue is brand, remarketing or returning customers?
- Did total store revenue increase when Google Ads revenue increased?
- What is the difference between attributed and incremental ROAS?
- Which campaign has the highest risk of claiming existing demand?
- Can the account access user-based or geo-based Conversion Lift?
- Is the proposed test sufficiently powered?
- What is the primary outcome: orders, new customers, revenue or contribution?
- How will stock, promotions and other media be controlled?
- How are refunds and returns included?
- What is the incremental contribution after ad spend?
- What budget action follows each possible result?
- When will the conclusion be tested again?
The practical answer
Google Ads almost certainly contains a mixture of outcomes:
- Sales genuinely created by advertising
- Sales accelerated or protected by advertising
- Sales influenced by several channels
- Sales that would have happened anyway
Attribution helps operate and optimise the platform, but it cannot determine the no-ad outcome by itself.
Use controlled experimentation to estimate incremental orders and value, then apply product margin, fulfilment, returns and advertising cost to calculate incremental contribution profit.
The correct conclusion is not that attribution is useless or that every branded conversion is false. It is that credit and causality answer different questions.
The budget should follow the advertising that creates the greatest additional profit—not the campaign that claims the greatest amount of revenue.
Frequently asked questions
How do you know whether Google Ads sales are incremental?
Run a controlled experiment comparing customers or regions exposed to the ads with a comparable group withheld from them. The difference in outcomes estimates the lift caused by advertising.
What is the difference between attribution and incrementality?
Attribution assigns conversion credit between recorded touchpoints. Incrementality estimates whether the conversion would have happened without the advertising.
Why do Brand Search campaigns often have low incrementality?
Brand searchers already know the business and may have strong purchase intent. Some would use organic search or visit directly if the advert did not appear. However, Brand Search can still defend demand and influence behaviour, so it should be tested rather than dismissed.
How do you calculate incremental ROAS?
Divide incremental conversion value by total advertising spend. For a profit-based view, calculate incremental contribution after product, fulfilment and return costs.
What is Google Conversion Lift?
It is an experimental measurement approach that compares conversion behaviour between groups that can see selected ads and groups withheld from them, producing metrics such as incremental conversions, value, CPA and ROAS.
Can small e-commerce businesses run incrementality tests?
They can, but low conversion volume makes small effects harder to detect. Smaller retailers may need longer tests, larger geographic groupings or a focus on high-spend campaigns where the expected effect is commercially material.
Should you pause Brand Search to test incrementality?
A controlled geo or user holdout is preferable. A carefully planned pause can provide directional evidence when better options are unavailable, but seasonality and other changes make simple before-and-after comparisons weaker.
How often should incrementality be tested?
Retest when spend, campaign structure, brand demand, customer mix or market conditions change materially. Prioritise the largest budgets and areas with the greatest overlap risk.
Measure the sales Google Ads genuinely creates
If Google Ads reports strong revenue but total business growth is not keeping pace, Clubbish can help identify whether the account is creating demand or mainly receiving credit for existing customers.
Our outcome-driven approach connects attribution with controlled testing, customer acquisition and contribution profit—giving marketing and e-commerce directors a clearer basis for budget allocation.
Book a strategy call to build a Google Ads measurement framework focused on the additional profit your advertising causes.