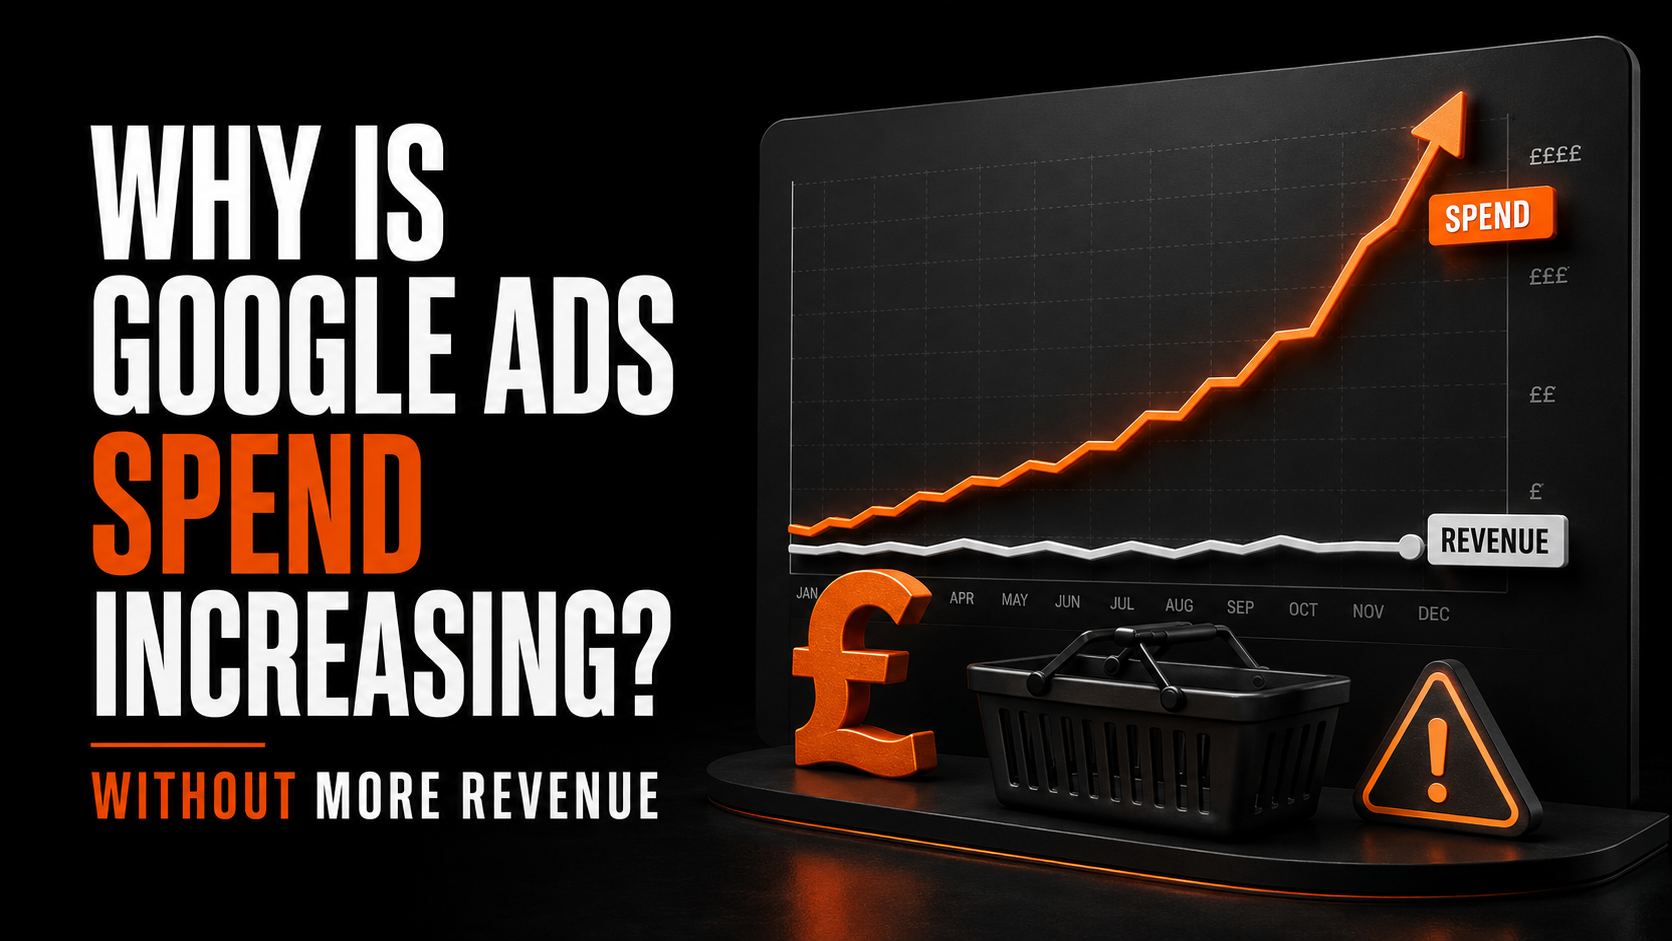
Google Ads spend can increase without a matching rise in e-commerce revenue when the account is paying more for the same traffic, attracting additional but weaker demand, converting fewer visitors, producing smaller orders or optimising towards incomplete conversion data.
It does not automatically mean Google Ads has stopped working or that customers have lost interest in the brand. It means one or more parts of the commercial equation have changed—and the account needs to be diagnosed before budgets or bidding targets are altered again.
The fastest way to find the cause is to establish whether the increase came from:
- More impressions and clicks
- A higher average cost per click
- A weaker conversion rate
- A lower average order value
- Poorer product availability or margin
- A measurement or attribution change
- Spend moving into less incremental demand
For a marketing director or head of e-commerce, the central question is not simply, “Why has ROAS fallen?” It is:
Which part of the revenue and profit equation changed, and did the additional spend create any incremental commercial value?
Start with the Google Ads revenue equation
Google Ads revenue can be decomposed into four connected variables:
Revenue = Spend × (Clicks ÷ Spend) × (Orders ÷ Clicks) × (Revenue ÷ Order)
In familiar terms:
Revenue = Spend × Click efficiency × Conversion rate × Average order value
The equation makes the investigation more disciplined. If spend rises by 30% but revenue increases by only 5%, one or several of the following must be true:
- The account received fewer clicks for each pound spent because CPC increased.
- It bought more clicks, but those clicks converted at a lower rate.
- Order volume increased, but average order value fell.
- Google Ads reported revenue differently from the commerce platform.
- Attributed revenue increased, but total store revenue did not, suggesting limited incrementality.
Do not begin by randomly adding negative keywords, cutting budgets or raising the target ROAS. First identify where the mathematical relationship broke.
The initial diagnostic scorecard
Compare the affected period with both the preceding period and the equivalent period last year. Use like-for-like dates, trading days and promotional conditions where possible.
| Metric | If it worsens | Likely explanation |
|---|---|---|
| Impressions | Rise rapidly while sales remain flat | Broader reach, changing demand or expansion into weaker inventory |
| CPC | Spend rises while clicks stay flat | Auction pressure, competition, bidding changes or weaker relevance |
| Clicks | Clicks rise but orders do not | Lower traffic quality or weaker commercial intent |
| Conversion rate | More visits produce fewer purchases | Site, offer, stock, checkout, device or intent problem |
| Average order value | Orders hold but revenue stalls | Product mix, promotions, bundles or discounting changed |
| Conversion value | Google and store revenue diverge | Tracking, currency, duplication, consent, refunds or attribution issue |
| ROAS | Spend grows faster than attributed value | Marginal efficiency is declining |
| Contribution profit | Revenue rises but profit does not | Margin, returns, fulfilment or product mix has deteriorated |
Add annotations for promotions, price changes, stockouts, feed updates, campaign launches, bid-strategy changes and website releases. Without that trading context, a clean-looking dashboard can still lead to the wrong conclusion.
Reason 1: Cost per click has increased
Google Ads operates through auctions. CPC can increase when competitors bid more aggressively, more advertisers enter the market, seasonal demand intensifies or the account starts entering more expensive auctions.
If spend is up while clicks are flat or down, CPC is the first place to look.
Compare:
- Average CPC by campaign and campaign type
- Search impression share and lost impression share due to rank or budget
- Brand versus non-brand CPC
- Device, location and time-of-day CPC
- Product-category and Shopping product-group CPC
- Top versus absolute-top impression rate where relevant
- Search partner and network performance
Google Ads’ Auction Insights reporting helps identify the advertisers competing in the same Search auctions and how competitive visibility has changed over time. Use it as context rather than proof that one competitor alone caused the increase. Google Ads: Auction Insights
Higher CPC is not automatically a problem. Paying more can be rational if the additional clicks convert at a higher rate, produce larger baskets, acquire valuable new customers or generate more contribution profit. It becomes a problem when click cost rises without a compensating improvement elsewhere.
Reason 2: The budget is reaching weaker demand
The first £100 per day often captures a different quality of demand from the next £100.
When a campaign has already secured the most commercially attractive auctions, additional budget may be spent on broader queries, less certain audiences, more expensive product searches or placements further from the purchase decision. Average reported ROAS can therefore fall as the account scales.
This is the difference between average return and marginal return:
- Average ROAS measures the return across all historical spend.
- Marginal ROAS measures the return generated by the next increment of spend.
Suppose a campaign spends £20,000 and generates £100,000 of attributed revenue: a 5x average ROAS. The budget then rises by £10,000 and total attributed revenue reaches £125,000. The account still reports a respectable 4.17x overall ROAS, but the additional £10,000 produced only £25,000—a marginal ROAS of 2.5x.
If the break-even return is 3.3x, that extra budget destroyed contribution profit even though the campaign-level average still looked healthy.
Reason 3: Search intent has weakened
A rise in clicks accompanied by a fall in conversion rate frequently indicates weaker traffic quality.
Potential causes include:
- Broader keyword matching
- New Dynamic Search Ads coverage
- Performance Max expansion
- Reduced exclusions or missing negative keywords
- Search terms moving from transactional to informational intent
- New locations or audience segments
- Generic product queries replacing specific model, brand or SKU searches
- More mobile discovery traffic with a longer path to purchase
Review actual search terms by cost, conversion value and commercial relevance. A query can be technically related to the product but still be commercially poor. “How to repair a coffee machine,” for example, may be relevant to a retailer selling coffee machines without representing meaningful buying intent.
Separate brand and non-brand demand. Branded Search commonly converts efficiently because it captures people already familiar with the retailer. If brand demand falls while broader non-brand coverage grows, blended campaign ROAS can decline even when execution has not materially worsened.
Do not judge all traffic by one account-wide target. Exact product searches, generic categories, competitor terms, remarketing and prospecting perform different jobs and should be evaluated with appropriate expectations.
Reason 4: Smart Bidding is optimising towards the wrong signal
Automated bidding is only as commercially intelligent as the conversion information it receives.
Google describes value-based bidding as a way to maximise conversion value within a budget or pursue a target ROAS. It differs from conversion-based bidding, which focuses on conversion volume. Google Ads: Value-based bidding
If the conversion values supplied to Google are duplicated, inflated, delayed or unrelated to actual profit, the system can efficiently optimise towards the wrong outcome.
Check that:
- Purchase is the principal conversion action used for e-commerce bidding.
- The campaign is actually using the goal containing that purchase action.
- Transaction IDs prevent duplicate order counting.
- Each order passes the correct value and currency.
- Add-to-baskets, page views and newsletter sign-ups are not unintentionally included as primary bidding conversions.
- Test, cancelled and fraudulent orders are excluded where possible.
- Refunds and returns are incorporated into commercial reporting.
- Imported Analytics purchases and native Google Ads purchases are not both counting the same transaction.
- Consent or checkout changes have not reduced observable conversion data.
- Value rules and new-customer values remain intentional and documented.
Google states that a conversion action must be set as Primary and its goal selected by the campaign for it to be used in bidding. Secondary actions normally appear separately, although a secondary action included in a custom goal can still influence bidding when that goal is assigned to a campaign. Google Ads: Conversion goals
This is why a conversion audit must examine settings, not simply the names displayed in reports.
Reason 5: A bidding or budget change altered delivery
Spend can accelerate after:
- Raising daily budgets
- Lowering a target ROAS
- Removing a target from Maximise Conversion Value
- Switching from manual or constrained bidding to automated bidding
- Changing the conversion goal
- Adding broad-match keywords
- Consolidating campaigns
- Launching Performance Max or Demand Gen
- Expanding geographic targeting
- Enabling automatically created assets or other expansion features
Google explains that Maximise Conversion Value aims to obtain the greatest conversion value from the available budget, while Target ROAS pursues conversion value within a specified return constraint. Google Ads: Bidding guidance
That distinction matters. If a profitable campaign previously spent below its budget because of a restrictive target, removing or reducing the target can give the system considerably more freedom to spend. Revenue may grow, but not at the same rate as cost.
Use Change History to identify who or what changed budgets, targets, goals, keywords, settings and assets around the point at which performance diverged. Google’s Change History can be viewed at campaign and ad-group level and includes changes made through the interface, automated systems and third-party tools. Google Ads: Change History
Reason 6: The website conversion rate has fallen
Google Ads can deliver similar traffic while revenue falls because the buying experience has deteriorated.
Common e-commerce causes include:
- Best-selling products going out of stock
- Prices becoming less competitive
- A promotion ending
- Delivery costs or delivery times increasing
- A mobile layout or checkout error
- Product variants failing to load
- Payment methods becoming unavailable
- Slower product and category pages
- Voucher codes or shipping thresholds malfunctioning
- Poorer product reviews or trust signals
- A shift towards products that are harder to purchase online
Segment conversion rate by campaign, device, browser, landing page, product category, country and new versus returning customer. The pattern often points directly to the fault.
For example:
- A mobile-only decline suggests a mobile experience or checkout issue.
- A single-category decline suggests stock, pricing, competition or merchandising.
- A decline across every paid campaign and organic traffic suggests a sitewide or market problem.
- Stable add-to-basket rates but weaker checkout completion suggests a transactional fault later in the funnel.
- Stable Google Ads conversion rate but weaker store revenue may indicate tracking overstatement.
Do not ask the media team to repair a commercial or technical website problem through bidding.
Reason 7: Average order value has fallen
Orders can rise while revenue remains flat if customers buy cheaper products or smaller baskets.
Average order value can decline because:
- Advertising shifts towards lower-priced product categories.
- Discounts reduce the captured order value.
- Bundles or cross-sells stop working.
- High-value items go out of stock.
- Free-delivery thresholds change basket-building behaviour.
- New customers initially spend less than returning customers.
- Campaigns optimise towards gross revenue without regard to product mix.
Break down Google Ads revenue by product, category and margin band. A campaign may appear to maintain conversion volume while directing demand towards products that generate less revenue and substantially less profit.
Reason 8: Product availability or the Shopping feed changed
For Shopping and Performance Max, feed health and stock availability can materially change where spend goes.
If profitable products become unavailable or disapproved, Google may redistribute traffic towards other eligible products. Total spend can continue even though the catalogue mix is commercially weaker.
Review:
- Merchant Center disapprovals and warnings
- Product eligibility and destination status
- Price and availability mismatches
- Missing GTINs and product attributes
- Product titles and category mapping
- The proportion of spend on low-margin products
- Newly added products receiving rapid traffic
- Best-selling products lost through stockouts
- Landing-page URLs after site changes
A feed can remain technically active while its most valuable commercial inventory has disappeared. Monitor eligible product count alongside revenue and margin by item ID.
Reason 9: Measurement has changed
Sometimes the advertising performance did not change as much as the reports suggest.
Investigate whether any of the following occurred near the date of divergence:
- Google Ads or Analytics tags were replaced.
- Consent-management settings changed.
- Enhanced conversions were introduced or stopped working.
- Attribution models or lookback windows changed.
- Cross-domain tracking broke during checkout.
- A new payment provider interrupted the journey.
- Currency conversion changed.
- Purchase events began firing twice.
- Revenue began including tax or delivery when it previously did not.
- Refunds were removed from one reporting source but not another.
- Shopify or another commerce platform changed how orders were reconciled.
Reconcile four numbers for the same order cohort:
- Completed orders in the commerce platform
- Purchase events and revenue in GA4
- Conversions and conversion value in Google Ads
- Settled revenue after cancellations, returns and refunds
These figures will rarely match perfectly because their attribution rules and reporting times differ. The goal is to understand and document the difference—not force artificial equality.
Reason 10: Attribution is being mistaken for incrementality
Google Ads reports the conversions attributed to advertising under the selected model. That is not identical to the sales caused by the advertising.
Brand Search, Shopping brand queries, remarketing and returning-customer campaigns may receive credit for people who already intended to buy. When budgets expand in these areas, attributed revenue can rise without an equivalent increase in total store revenue.
Compare platform performance with:
- Total store revenue
- Blended marketing efficiency ratio
- New-customer orders and revenue
- New-customer acquisition cost
- Contribution profit after advertising
- Brand versus non-brand performance
- Direct, organic and email revenue movements
- Geographic, audience or time-based holdout tests where practical
If Google Ads revenue increases by £100,000 while total store revenue rises by only £20,000 under broadly stable trading conditions, it is unlikely that the entire attributed increase represents new value. Other channels may have lost credit, or paid activity may be intercepting existing demand.
Use profit, not revenue alone
Even a matching increase in revenue would not necessarily justify the higher spend.
Calculate contribution profit after advertising:
Contribution profit after ads = Revenue − cost of goods − fulfilment − payment fees − discounts − expected returns − advertising spend
Suppose Google Ads changes as follows:
| Metric | Before | After |
| Spend | £30,000 | £45,000 |
| Attributed revenue | £135,000 | £171,000 |
| ROAS | 4.5x | 3.8x |
| Pre-ad contribution margin | 35% | 32% |
| Pre-ad contribution | £47,250 | £54,720 |
| Contribution after ads | £17,250 | £9,720 |
Revenue increased by £36,000, but contribution after advertising fell by £7,530. The additional spend attracted a weaker product mix and did not generate enough margin to justify the scale.
This is why a board-level Google Ads report should not stop at spend, revenue and ROAS.
A structured 60-minute investigation
Minutes 0–10: Confirm the dates and business context
Establish when the gap began. Check seasonality, promotions, price, stock, delivery proposition, website releases and wider demand. Compare the same weekdays and account for major sales events.
Minutes 10–20: Reconcile measurement
Compare Google Ads, GA4 and commerce-platform orders and value. Check transaction IDs, currencies, duplicates, consent, refunds and attribution settings.
Minutes 20–30: Decompose the revenue equation
Measure the percentage change in spend, CPC, clicks, conversion rate, orders and average order value. Identify which variable explains most of the gap.
Minutes 30–40: Find where the change is concentrated
Segment by campaign, brand/non-brand, campaign type, product, device, location, audience and new/returning customer. Avoid averaging away the problem.
Minutes 40–50: Review changes and traffic quality
Use Change History. Inspect search terms, placements, product groups, feed status, budget changes, bid targets and conversion goals.
Minutes 50–60: Decide the commercial action
Quantify the marginal return and contribution profit. Protect profitable demand, reduce evident waste, correct measurement defects and define a controlled test for any uncertain diagnosis.
What action should you take for each diagnosis?
| Diagnosis | Appropriate response |
| CPC increased but conversion economics remain healthy | Accept the higher price selectively or improve relevance, structure and coverage |
| Spend expanded into weak queries | Add negatives, refine match types and isolate intent groups |
| Marginal return fell after a budget increase | Reduce or reallocate the incremental budget; test smaller steps |
| Conversion tracking is wrong | Repair measurement before making bidding decisions |
| Smart Bidding uses weak goals | Remove inappropriate primary actions and pass reliable purchase values |
| Conversion rate fell sitewide | Fix stock, pricing, page or checkout issues before scaling traffic |
| AOV or margin fell | Segment products and use commercially adjusted values or targets |
| Feed mix deteriorated | Resolve disapprovals, availability and product-data issues |
| Brand or remarketing is over-credited | Separate reporting and assess incrementality |
| New-customer growth is profitable despite lower ROAS | Retain investment if payback and lifetime value support it |
The correct response is not always to cut spend. If higher spend produces more profitable new customers with an acceptable payback period, a lower platform ROAS may be strategically sensible. Equally, a visually strong ROAS may not protect an expansion that generates no incremental profit.
How to prevent the problem recurring
Build control points into the account and reporting process.
Set commercially derived targets
Calculate break-even ROAS by product or margin group rather than imposing one universal target. Include cost of goods, fulfilment, payment fees, discounts and expected returns.
Separate fundamentally different demand
Report brand, non-brand, Shopping, Performance Max, prospecting, remarketing, new customers and returning customers distinctly wherever data and structure allow.
Monitor marginal performance
When increasing budgets, measure what the additional spend produced. Do not rely only on the blended historical average.
Maintain a change log
Record major budget, bidding, tracking, feed, promotion and website changes with dates and expected effects. Google Ads Change History is valuable, but it will not contain every commercial decision made outside the platform.
Reconcile revenue monthly
Create an agreed bridge between Google Ads conversion value and settled commerce revenue. Explain differences due to attribution, consent, cancellations, returns, tax and delivery.
Use controlled budget increases
Scale in measured increments where possible. Define success and stop conditions before the increase so a temporary learning period does not become an indefinite excuse for unprofitable spend.
A reporting framework for marketing directors
Weekly operational view
- Spend, impressions, clicks and CPC
- Conversion rate, orders, value and ROAS
- Search terms, placements and product groups
- Merchant Center issues and stock availability
- Significant account changes
- Website and checkout alerts
Monthly commercial view
- Google Ads revenue reconciled with commerce revenue
- Contribution profit after advertising
- New-customer orders, revenue and CAC
- Brand versus non-brand performance
- Product-category revenue and margin
- Blended MER
- Marginal return from budget changes
- Refunds and realised revenue
Quarterly strategic view
- Incremental revenue and profit testing
- Customer lifetime value and payback
- Channel interaction and cannibalisation
- Budget allocation by marginal contribution
- Demand creation versus demand capture
- Areas where feed, website or merchandising work would improve paid efficiency
Questions to ask your agency or internal team
When Google Ads spend is increasing without matching revenue, ask:
- On what exact date did performance diverge?
- Which metric explains the gap: CPC, clicks, conversion rate or AOV?
- Which campaigns, products, devices and locations account for the increase?
- What changed in the account immediately beforehand?
- Has purchase tracking been reconciled against actual orders?
- Which conversion actions are Primary and used for bidding?
- How much of the spend and revenue is brand or returning-customer demand?
- What was the marginal ROAS of the most recent budget increase?
- What contribution profit did the additional spend produce?
- Did stock, price, delivery, promotions or returns change?
- Are we acquiring more genuinely new customers?
- What test will confirm the proposed explanation?
The team should be able to answer with segmented evidence. “Competition increased” or “the algorithm is learning” may be contributing factors, but neither is a complete commercial diagnosis.
Common mistakes when revenue fails to keep pace
Raising the target ROAS immediately
A tighter target may reduce spend, but it can also suppress valuable demand and disguise the actual cause. Fix measurement and identify the weak segment first.
Cutting every campaign equally
Blanket reductions can remove profitable brand, category or product demand while leaving the underlying source of waste unresolved.
Looking only inside Google Ads
Stock, pricing, promotions, competitors, checkout performance and customer demand can change independently of the advertising account.
Using year-on-year comparisons without context
The comparison is valuable only when major differences in promotions, inventory, prices, weather, trading days and market conditions are explained.
Treating all attributed revenue as incremental
Platform attribution assigns credit; it does not prove that the sale would not otherwise have happened.
Allowing a strong historical average to protect weak new spend
Past efficient conversions can hide poor marginal performance. Evaluate the return on the extra investment separately.
The bottom line
If Google Ads spend is increasing without a matching increase in revenue, do not start with a campaign-level ROAS target. Start with the revenue equation.
Determine whether the account is:
- Paying more for the same traffic
- Buying more but weaker traffic
- Converting visitors less effectively
- Generating smaller orders
- Losing profitable inventory
- Optimising towards faulty values
- Receiving attribution for sales it did not incrementally create
Then calculate what happened to contribution profit and new-customer acquisition—not only attributed revenue.
The right objective is not to make spend and revenue rise at precisely the same percentage. It is to ensure that each additional pound invested creates enough incremental contribution and future customer value to justify the cost.
Frequently asked questions
Why has Google Ads spend suddenly increased?
Common causes include budget or bid-target changes, broader targeting, a new campaign, higher auction costs, changes to conversion goals or automated bidding gaining more freedom to spend. Check Change History and segment the increase by campaign before making further changes.
Why are Google Ads clicks increasing but sales are not?
The added clicks may have weaker purchase intent, or the website conversion rate may have fallen. Review search terms, product groups, devices, landing pages, stock, pricing and checkout performance.
Can Google Ads spend more than the daily budget?
Google may spend above the average daily budget on individual high-opportunity days while applying its campaign spending limits over the billing period. Budget diagnostics should therefore compare appropriate date ranges rather than isolated days.
Should we reduce the budget when ROAS falls?
Not automatically. First identify whether the decline comes from tracking, CPC, traffic quality, conversion rate, AOV, product mix or deliberate new-customer acquisition. Reduce or reallocate spend when the marginal commercial return is below the acceptable threshold.
Can Performance Max increase spend without increasing revenue?
Yes. Like other campaign types, it can expand into less efficient inventory, optimise towards inappropriate conversion values or redirect spend after stock and feed changes. Evaluate asset groups, product groups, search-term insights, new-customer performance and total commercial impact.
What should we measure instead of platform ROAS?
Use ROAS alongside contribution profit after advertising, new-customer CAC, blended MER, payback period, lifetime value and incremental revenue or profit.
How long should we wait after a Google Ads change?
Allow enough time for conversion delay and automated bidding to stabilise, but monitor measurement, spend and commercial risk immediately. The appropriate window depends on conversion volume, purchase cycle and the size of the change; it should be agreed before launch.
Turn rising Google Ads spend into profitable growth
If your Google Ads costs are rising faster than revenue, Clubbish can help identify whether the problem sits in media buying, measurement, product economics or the customer journey.
Our outcome-driven approach connects Google Ads data with store revenue, contribution margin and new-customer growth—giving marketing and e-commerce directors a clearer basis for budget decisions.
Book a strategy call to diagnose where the additional spend is going and build a plan for profitable, measurable growth.