
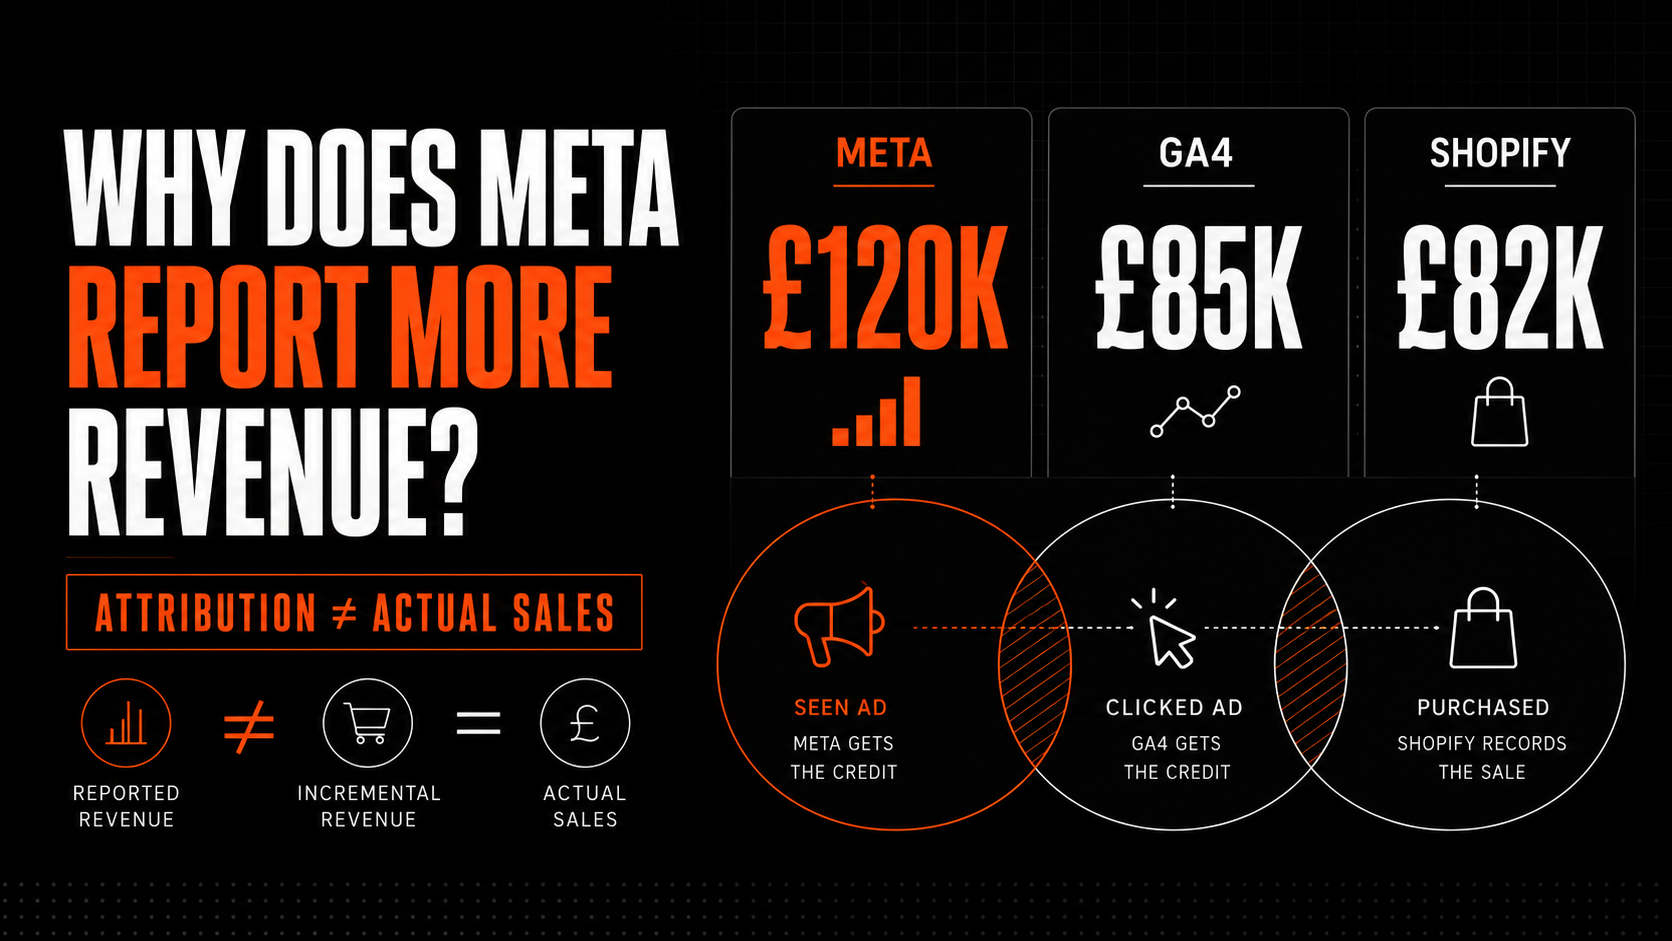
Why does Meta report more revenue than GA4 or Shopify? The main reason is that the three platforms use different attribution windows, data sources and reporting rules. Meta reports purchases it can associate with Facebook and Instagram advertising. GA4 records website or app events and distributes credit according to its attribution settings. Shopify records the orders actually placed, then applies separate attribution rules in its marketing reports.
Some disagreement is therefore normal. It becomes a concern when the gap is unusually large, appears suddenly or cannot be explained by attribution windows, view-through conversions, reporting dates or revenue definitions. In those cases, duplicate purchase events, incorrect order values, consent loss or a broken integration may be inflating or suppressing the numbers.
For management decisions, the objective should not be to make all three dashboards match. It should be to establish:
- How many valid orders and how much net revenue the store generated.
- Which customer journeys each platform can observe.
- Why each platform awarded marketing credit differently.
- How much revenue and contribution profit Meta actually caused.
The three systems answer different questions
To understand why Meta reports more revenue than GA4 or Shopify, you first need to separate actual order revenue from the marketing credit assigned by each platform.
| Platform | Main question | Typical perspective |
|---|---|---|
| Meta Ads Manager | Which conversions can Meta associate with our ads? | Ad clicks, eligible ad views, Meta Pixel, Conversions API, matching and modelling |
| GA4 | How did users interact with the website or app, and which touchpoints receive credit? | Observed events, sessions, traffic sources, consented data and the selected attribution model |
| Shopify | Which orders were placed, and which marketing source receives credit under Shopify’s rules? | Orders, products, discounts, refunds and Shopify’s attribution model |
Shopify supports several marketing attribution views, including last non-direct click, last click, first click, any click and linear attribution. GA4 also allows administrators to choose a reporting attribution model, the channels eligible for credit and key-event lookback windows. Meta applies its attribution setting at ad-set level and can report conversions after eligible clicks and views.
Exact agreement would be surprising because the systems use different data, identities, time windows and rules.
One order can create three different answers
Consider this customer journey:
- On Monday, a shopper sees a Meta prospecting ad on Instagram but does not click.
- On Wednesday, they search for the brand and click an organic Google result.
- On Thursday, they return directly and place a £150 order.
Meta may claim £150 if the purchase falls within an eligible view-through window. GA4 may give credit to Organic Search under its selected model because it observed that website visit but not the Instagram impression. Shopify may award the order to organic search under last non-direct click, or to direct under last click.
Shopify still has one £150 order. The other systems have not created additional revenue; they have applied different credit to the same commercial event.
This is why adding Meta-attributed revenue, Google Ads revenue, GA4 organic revenue and email-attributed revenue together frequently produces a number greater than total store sales. Attribution is non-exclusive unless the reporting framework deliberately makes it exclusive.
Why Meta often reports more revenue
Meta uses different attribution windows
Meta’s attribution settings can count conversions after a one-day or seven-day link click and after a one-day view. The precise options and settings should be checked in the live ad account rather than assumed.
A broader window gives Meta more opportunities to associate a later purchase with an earlier ad interaction. If GA4 awards credit to the last non-direct website visit while Meta looks back seven days to an ad click, both can claim influence over the same order.
When reconciling reports, document the following:
- Meta click-through, engage-through and view-through settings.
- GA4 reporting attribution model and key-event lookback window.
- Shopify attribution model selected in the report.
- Whether the comparison includes all campaigns, countries and devices.
Without those controls, a channel comparison is not like for like.
Meta can count view-through conversions
View-through attribution is one of the most common reasons Meta reports more revenue than GA4 or Shopify. Meta can know that an eligible user was shown an ad even when that person did not click it. GA4 receives no Meta campaign session in that journey, so it cannot attribute the later website purchase to the unseen impression in the same way.
View-through credit is not automatically false. Advertising can create awareness without generating an immediate click. However, an impression followed by a purchase does not prove the impression caused the purchase. Existing brand demand, email, organic search, retail exposure or prior customer experience may have produced the sale anyway.
Compare click-only and view-inclusive Meta results separately. That shows how much reported revenue depends on impression-based credit and identifies campaigns whose apparent return changes sharply when view-through conversions are excluded.
The attribution models differ
GA4’s data-driven attribution can distribute fractional credit across eligible interactions. Its paid-and-organic last-click model instead gives all key-event value to the last qualifying clicked channel, ignoring direct traffic. Shopify can show several alternative models, each producing a different channel total.
Meta is a self-attributing platform: it reports conversions that meet its own association and attribution rules. It does not relinquish credit merely because Google, email or direct traffic appeared later in the journey.
This creates overlap. If Meta claims £100 and GA4 gives Meta £30 of fractional credit for the same purchase, the £70 difference is not necessarily missing revenue or a technical fault. It is a difference in attribution methodology.
The reports can use different dates
Reporting time can shift revenue between days, weeks and months. A platform may associate conversion credit with the date of an advertising interaction, while an order system naturally records the purchase on the date it occurred. GA4’s attribution reporting also offers event-time and ad-interaction-time perspectives.
Suppose an ad click occurs on 30 June and the order is placed on 3 July. A June Meta campaign report and a July Shopify sales report can both include the commercial relationship in different periods. Short date comparisons around month end, promotional periods and financial reporting deadlines are particularly vulnerable to this effect.
Use longer windows and allow for conversion lag. For order reconciliation, use purchase date wherever possible. For campaign optimisation, understand the platform’s reporting-time convention before interpreting daily movements.
Meta may observe and model journeys GA4 cannot
Consent choices, browser restrictions, ad blockers, cross-device behaviour and cookie loss create gaps in every digital analytics system. Meta can combine Pixel and Conversions API signals with matching and modelling. GA4 uses its own observed and modelled data. Shopify can see the completed order but might not receive a reliable referrer or campaign identifier.
More observable data does not automatically make Meta’s attribution causal or commercially correct. It means Meta has more signals with which to associate a purchase. The quality of that association depends on implementation, matching and the attribution rules applied.
Revenue definitions are not aligned
Before comparing revenue, establish exactly what each field includes:
| Value component | Potential source of disagreement |
| Product sales | Gross item value versus net sales after discounts |
| Shipping | Included in one purchase value but excluded in another |
| Tax | Passed to Meta but excluded from the Shopify comparison, or vice versa |
| Discounts | Pre-discount catalogue value accidentally sent instead of amount paid |
| Refunds and returns | Shopify updated later while Meta retains the original purchase value |
| Cancellations | Order cancelled in the store but not adjusted in advertising reports |
| Gift cards | Treated as revenue at purchase, redemption or both |
| Currency | Wrong currency code, conversion rate or decimal format |
| Subscriptions | Initial order, renewal and lifetime value treated differently |
Meta commonly receives the purchase value at transaction time. Shopify may later reflect returns, partial refunds and cancellations. Comparing Meta’s gross attributed value with Shopify net sales after returns will exaggerate the gap even if every purchase event fired correctly.
When the discrepancy is probably normal
A reporting difference is usually explainable when:
- Meta includes view-through attribution and the comparison is click-based.
- Meta’s attribution window is broader than the GA4 or Shopify view.
- A customer clicked or viewed Meta, then purchased through another channel.
- The systems use different attribution models or lookback windows.
- Meta and the store place the value in different reporting periods.
- One report includes tax or shipping while another does not.
- Shopify has processed refunds that have not reduced Meta’s original value.
- Privacy and cross-device behaviour mean each system observes different parts of the journey.
The gap should be stable enough to explain by campaign type and attribution setting. Prospecting video campaigns, for example, may naturally have more view-through credit than click-led retargeting or catalogue campaigns.
When the gap indicates a tracking problem
Investigate promptly if:
- Meta reports more purchases than the store received in total.
- Meta revenue is close to twice Shopify revenue after a new Pixel or Conversions API launch.
- The discrepancy begins immediately after checkout, consent or theme changes.
- Every purchase carries the same value despite varied basket sizes.
- Meta receives purchases for which no real Shopify order exists.
- One device, country, domain or checkout route accounts for most of the difference.
- Reported Meta revenue rises sharply while store revenue, orders and blended efficiency remain flat.
- Event diagnostics show poor deduplication or deteriorating match quality.
A simple duplication example
Assume Shopify records 100 valid orders worth £10,000. The Meta Pixel sends 100 browser Purchase events and the Conversions API sends the same 100 events from the server.
If each pair carries the same event name and event ID, Meta can identify the browser and server messages as the same commercial event:
100 browser events + 100 matching server events = 100 deduplicated purchases
If event IDs are missing or do not match, the platform may receive what appear to be 200 different purchases:
100 real orders could produce 200 reported purchase events if deduplication fails.
Meta’s implementation guidance says the browser and server versions should send the same event_name and event_id so identical events can be deduplicated. A near-twofold increase after adding Conversions API is therefore a strong reason to audit event IDs immediately.
Other common technical causes include:
- Purchase firing when the confirmation page loads and firing again when it refreshes.
- Two Meta Pixels or tag-manager containers sending the same event.
- A server integration and a Shopify app both sending purchases without shared event IDs.
- A static basket value used for every transaction.
- Pounds being sent as pence, or a decimal separator being parsed incorrectly.
- Test and draft orders being sent as completed purchases.
- A purchase event firing before payment is accepted.
- Subscription renewals or upsells being counted inconsistently.
How to reconcile Meta, GA4 and Shopify
1. Define the financial control total
Start with Shopify’s valid orders, not a marketing attribution report. Agree a commercial definition such as:
Net order revenue = Gross product sales − discounts − refunds
Decide how tax, shipping, gift cards, duties and cancellations will be treated. Use the same currency and timezone. This becomes the control total against which event counts and values are reconciled.
Shopify is the most appropriate source for order existence and store-level financial facts, but its channel attribution is still a marketing model rather than proof of causality.
2. Reconcile purchase counts before revenue
Order count is easier to diagnose than value. Compare:
- Valid Shopify orders.
- GA4
purchaseevents and unique transaction IDs. - Meta Purchase events received, deduplicated and attributed.
Do not expect Meta-attributed purchases to equal total orders, but do investigate duplicate transaction IDs, missing events and impossible counts. If counts reconcile but value does not, concentrate on tax, shipping, discounts, refunds, currency and dynamic value parameters.
3. Standardise dates, timezones and attribution settings
Use the same timezone and a sufficiently long date range. Record each platform’s reporting-time convention. In Meta, compare narrow click-only attribution with the broader live setting. In Shopify, run a comparable click model. In GA4, document the reporting model, lookback window and reporting time.
This comparison will not make the methods identical, but it removes avoidable differences.
4. Audit Pixel and Conversions API events
For browser and server Purchase events, confirm:
event_nameis consistentlyPurchase.- The same unique
event_idis present on both versions of one order. - Event value and currency match the paid order.
- The purchase fires only after successful completion.
- Test orders are identifiable and excluded from production analysis.
- Only the intended Pixel, partner app and server integration send the event.
Review Meta Events Manager diagnostics and event details rather than relying solely on Ads Manager totals.
5. Run controlled test orders
Place test orders through representative routes: desktop, mobile, guest checkout, express payment and subscription checkout where relevant. For each order, record the order ID, value, currency and timestamp.
Validate the transaction in:
- Shopify’s order record.
- Meta’s Test Events or Events Manager diagnostics.
- GA4 DebugView and subsequent reporting.
- Tag-manager and consent logs where available.
Test refunds and cancellations too. A perfect purchase event does not guarantee that later commercial adjustments flow correctly.
6. Segment the discrepancy
Break the gap down by:
- Prospecting versus retargeting.
- New versus returning customers.
- Click-through versus view-through attribution.
- Campaign, ad set and creative.
- Device and browser.
- Country, currency and store market.
- Standard checkout versus accelerated payment methods.
- Product category, margin band and return rate.
A sitewide average conceals causes. If the difference is almost entirely view-through revenue from retargeting, the response is different from a duplicated Purchase event on every order.
A management scorecard that avoids false precision
| Measure | Recommended source | Management use |
| Valid orders and net sales | Shopify/finance data | Commercial control total |
| Meta-attributed purchases and ROAS | Meta Ads Manager | Optimising campaigns within Meta |
| Website journeys and channel interaction | GA4 | Cross-channel and landing-page analysis |
| New-customer revenue | Shopify customer/order data | Acquisition quality |
| Contribution profit | Finance or BI model | Budget and profitability decisions |
| Blended MER | Total store revenue / total marketing spend | Whole-business efficiency trend |
| Incremental revenue and profit | Controlled experiment | Causal budget allocation |
The report should show Meta-attributed revenue alongside Shopify net sales, not present them as interchangeable. It should also include the percentage of Meta revenue coming from view-through activity, new-customer share and the difference between reported and blended business performance.
Which number should you trust?
Trust the system that matches the decision:
- Use Meta to compare delivery, creative, audiences and campaigns under a consistent Meta reporting setup.
- Use GA4 to understand website behaviour, landing pages and cross-channel journeys, accepting that consent and identity loss create limitations.
- Use Shopify to confirm orders, products, discounts, refunds and store revenue.
- Use finance or BI data to calculate contribution profit after product, fulfilment, payment and return costs.
- Use incrementality testing to estimate what Meta actually caused.
No attribution dashboard can prove that a purchase would not have happened without advertising.
Move from attribution to incrementality
Once tracking is technically reliable, the bigger commercial question is not whether Meta’s number matches GA4. It is whether the advertising increased total sales and profit.
Use an eligible Meta lift study, a geographic holdout or another controlled experiment to compare an exposed group with a credible unexposed control. Then calculate:
Incremental ROAS = Incremental revenue caused by Meta ÷ Meta ad spend
For investment decisions, use profit:
Incremental contribution profit = Incremental revenue − cost of goods − fulfilment − payment fees − returns − Meta ad spend
A campaign can have a strong platform ROAS but weak incremental profit if it mainly retargets existing customers or intercepts branded demand. Conversely, a prospecting campaign may look weaker in last-click reports yet create valuable new customers and later branded or direct sales.
Common reconciliation mistakes
- Treating Shopify marketing attribution as identical to Shopify order truth.
- Comparing Meta’s view-inclusive revenue with GA4 last-click revenue.
- Comparing gross purchase value with net sales after refunds.
- Adding platform-attributed revenue together.
- Reviewing a short period without accounting for conversion lag.
- Changing attribution settings while comparing month-on-month performance.
- Assuming Conversions API is accurate without checking deduplication.
- Optimising to Meta ROAS before confirming contribution margin and customer type.
- Trying to force exact dashboard agreement instead of explaining the variance.
A practical monthly process
- Reconcile Shopify orders, cancellations and refunds to the financial total.
- Compare GA4 transaction IDs and revenue with the valid order file.
- Review Meta event receipt, deduplication and diagnostics.
- Separate Meta click-through and view-through attributed results.
- Explain differences by attribution model, date and revenue definition.
- Segment performance by campaign type and new versus returning customer.
- Report blended revenue, contribution profit and new-customer economics.
- Schedule incrementality testing for material spend or disputed campaigns.
This turns the discrepancy from a recurring boardroom argument into an auditable measurement process.
Frequently asked questions
Is Meta wrong if it reports more revenue than Shopify?
Not necessarily. Meta can associate the same real orders with advertising using click-through and view-through rules, while Shopify’s channel report uses a different attribution model. Meta is wrong at the event level if it records duplicated or invalid purchases, but a higher attributed total alone does not prove that.
Can Meta report more purchases than the store received?
It can appear to, particularly when comparing different dates or attribution periods, but persistent Meta purchase-event counts above real orders require investigation. Check Pixel and Conversions API deduplication, confirmation-page reloads, multiple tags, test orders and event timing.
Should Meta ROAS be compared directly with GA4 ROAS?
Only with strong qualifications. The platforms may use different windows, attribution models and observable data. Use each for internal optimisation, then judge business performance with store revenue, customer acquisition, contribution profit, blended MER and incrementality.
Does Conversions API make Meta revenue more accurate?
It can improve signal resilience and matching, but only if implementation is correct. Browser and server events must be deduplicated, order values must be accurate and events must represent valid purchases. More data is not the same as more causal revenue.
What size discrepancy is acceptable?
There is no universal percentage. Establish a normal range for your account after aligning definitions and settings. Investigate changes outside that range, especially if they coincide with technical releases or produce impossible order counts.
The practical answer
Meta reports more revenue than GA4 or Shopify chiefly because it uses its own attribution windows, can count eligible view-through conversions and observes a different portion of the customer journey. GA4 applies its selected web and app attribution methodology, while Shopify records the underlying orders and offers separate marketing-credit models.
Start by proving that the purchase events and order values are technically correct. Then reconcile differences in windows, dates, attribution and revenue definitions. Finally, use controlled testing to determine whether Meta generated additional contribution profit rather than merely receiving credit for sales that would have occurred anyway.
If your dashboards disagree and the team cannot confidently explain why, Clubbish can audit your Meta Pixel, Conversions API, GA4, Shopify attribution and commercial reporting—then build a measurement framework that supports profitable budget decisions rather than competing platform claims.